Consumer Behavior Prediction using Parametric and Nonparametric Methods
530 likes | 548 Views
Consumer Behavior Prediction using Parametric and Nonparametric Methods. Elena Eneva Carnegie Mellon University 25 November 2002. eneva@cs.cmu.edu. Recent Research Projects. Dimensionality Reduction Methods and Fractal Dimension (with Christos Faloutsos)

Consumer Behavior Prediction using Parametric and Nonparametric Methods
E N D
Presentation Transcript
Consumer Behavior Prediction using Parametric and Nonparametric Methods Elena Eneva Carnegie Mellon University 25 November 2002 eneva@cs.cmu.edu
Recent Research Projects • Dimensionality Reduction Methods and Fractal Dimension(with Christos Faloutsos) • Learning to Change Taxonomies(with Valery Petrushin, Accenture Technology Labs) • Text Re-Classification Using Existing Schemas(with Yiming Yang) • Learning Within-Sentence Semantic Coherence(with Roni Rosenfeld) • Automatic Document Summarization(with John Lafferty) • Consumer Behavior Prediction(with Alan Montgomery [Business school] and Rich Caruana [SCS])
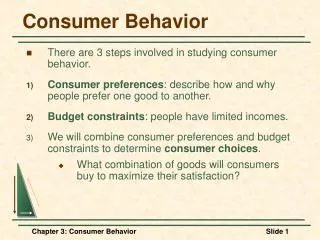
Outline • Introduction & Motivation • Dataset • Baseline Models • New Hybrid Models • Results • Summary & Work in Progress
How to increase profits? • Without raising the overall price level? • Without more advertising? • Without attracting new customers?
A: Better Pricing Strategies Encourage the demand for products which are most profitable for the store • Recent trend to consolidate independent stores into chains • Pricing doesn’t take into account the variability of demand due to neighborhood differences.
A: Micro-Marketing • Pricing strategies should adapt to the neighborhood demand • The basis: the difference in interbrand competition in different stores • Stores can increase operating profit margins by 33% to 83% [Montgomery 1997]
Understanding Demand • Need to understand the relationship between the prices of products in a category and the demand for these products • Price Elasticity of Demand
inelastic elastic Price Elasticity consumer’s response to price change Q is quantity purchased P is price of product
Prices and Quantities • Q demanded of a specific product is a function of the prices of all the products in that category • This function is different for every store, for every category
Price of Product 1 Quantity bought of Product 1 Quantity bought of Product 2 Price of Product 2 Predictor Price of Product 3 Quantity bought of Product 3 Category . . . . . . “I know your customers” Quantity bought of Product N Price of Product N The Function Need to multiply this across many stores, many categories.
How to find this function? • Traditionally – using parametric models (linear regression)
Price of Product 1 Quantity bought of Product 1 Quantity bought of Product 2 Price of Product 2 Predictor Price of Product 3 Quantity bought of Product 3 Category . . . . . . “I know your customers” convert to ln space convert to original space Quantity bought of Product N Price of Product N The Function Need to multiply this across many stores, many categories.
How to find this function? • Traditionally – using parametric models (linear regression) • Recently – using non-parametric models (neural networks)
Take Advantage: use the known functional form to bias the NN • Build hybrid models from the baseline models new accuracy NN LR robustness Our Goal • Advantage of LR: known functional form (linear in log space), extrapolation ability • Advantage of NN: flexibility, accuracy
Evaluation Measure • Root Mean Squared Error (RMS) • the average deviation between the true quantity and the predicted quantity
Error Measure – Unbiased Model which is an unbiased estimator for q. but by computing the integral over the distribution is a biased estimator for q, and we correct the bias by using
Dataset • Store-level cash register data at the product level for 100 stores • Store prices updated every week • Two Years of transactions • Chilled Orange Juice category (12 Products)
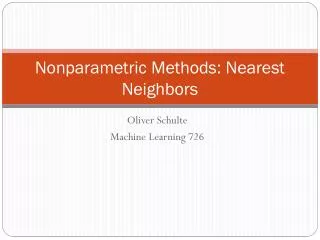
Models • Hybrids • Smart Prior • MultiTask Learning • Jumping Connections • Frozen Jumping Connections • Baselines • Linear Regression • Neural Networks
Baselines • Linear Regression • Neural Networks
Linear Regression • q is the quantity demanded • pi is the price for the ith product • K products overall • The coefficients a and bi are determined by the condition that the sum of the square residuals is as small as possible.
Neural Networks • Generic nonlinear function approximators • Collection of basic units (neurons), computing a (non)linear function of their input • Random initialization • Backpropagation • Early stopping to prevent overfitting
Neural Networks 1 hidden layer, 100 units, sigmoid activation function
Results RMS RMS
Hybrid Models • Smart Prior • MultiTask Learning • Jumping Connections • Frozen Jumping Connections
Smart Prior Idea: Initialize the NN with a “good” set of weights; help it start from a “smart” prior. • Start the search in a state which already gives a linear approximation • NN training in 2 stages • First, on synthetic data (generated by the LR model) • Second, on the real data
Smart Prior LR
Results RMS RMS
Multitask Learning [Caruana 1997] Idea: learning an additional related task in parallel, using a shared representation • Adding the output of the LR model (built over the same inputs) as an extra output to the NN • Make the NN share its hidden nodes between both tasks
MultiTask Learning • Custom halting function • Custom RMS function
Results RMS RMS
Jumping Connections Idea: fusing LR and NN • Modify architecture of the NN • Add connections which “jump” over the hidden layer • Gives the effect of simulating a LR and NN together
Results RMS RMS
Frozen Jumping Connections Idea: show the model what the “jump” is for • Same architecture as Jumping Connections, but two training stages • Freeze the weights of the jumping layer, so the network can’t “forget” about the linearity
Results RMS RMS
Models • Baselines: • Linear Regression • Neural Networks • Hybrids • Smart Prior • MultiTask Learning • Jumping Connections • Frozen Jumping Connections • Combinations • Voting • Weighted Average
Combining Models Idea: Ensemble Learning Use all models and then combine their predictions • Committee Voting • Weighted Average 2 baseline and 3 hybrid models (Smart Prior, MultiTask Learning, Frozen Jumping Conections)
Committee Voting • Average the predictions of the models
Results RMS RMS
Weighted Average – Model Regression • Optimal weights determined by a linear regression model over the predictions
Results RMS RMS
Normalized RMS Error • Compare model performance across stores with different: • Sizes • Ages • Locations • Need to normalize • Compare to baselines • Take the error of the LR benchmark as unit error