Download
1 / 20
200 likes | 302 Views
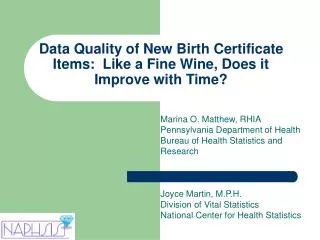
Data Quality of New Birth Certificate Items: Like a Fine Wine, Does it Improve with Time?. Marina O. Matthew, RHIA Pennsylvania Department of Health Bureau of Health Statistics and Research Joyce Martin, M.P.H. Division of Vital Statistics National Center for Health Statistics.

E N D
Data Quality of New Birth Certificate Items: Like a Fine Wine, Does it Improve with Time? Marina O. Matthew, RHIA Pennsylvania Department of Health Bureau of Health Statistics and Research Joyce Martin, M.P.H. Division of Vital Statistics National Center for Health Statistics
Data Items Not Released • Time of birth • Facility – State hospital code (NPI) • Mother married ever? • Mother not married -- • Acknowledgement signed? • Father’s education • Date of last live birth • Date of last other outcome • Date of last prenatal visit • Plurality – Set order • Number live born • Matching certificate number • Number of cigs smoked 3 • months prior to pregnancy • Source of payment • Mother’s height • WIC food during pregnancy? • Infections present • APGAR 10 minutes • Maternal morbidity • Infant transferred within 24 hrs • Mother transferred • Infant living at time of report • Infant being breastfed • Infertility treatment
WA ME MT ND MN VT OR NYC NH MA ID WI NY SD CT WY MI RI PA IA NJ NE NV OH DE IN IL UT MD CO WV VA KS MO CA KY NC TN OK AZ AR SC NM GA AL MS TX LA FL AK HI Year of Revision to 2003 Birth Certificate by State DC 2003 or 2004 2005 2006 2007 2008 2009 or later Mid-year / rolling / partial reviser NOTE: New York State but not New York City implemented for 2004. New York City implemented in 2008.
Revision status Year2003 2004 2005 2006 # of states2 7 12 19 # of births226,448 571,858 1.3 m 2.9 m % U.S. births 6 14 31 49
Distribution of births by race/Hispanic origin 30 revised states (2.9 million in 2006) US births (4.3 million in 2006) NOTE: Distributions based on 2006 preliminary birth data. Revised states have implemented the 2003 revision of the U.S. Standard Certificate of Live birth as of 2008.
Percent of Records With Not Stated Data For Infant Breastfed:Revised states, 2003-2006 State A State C State B Percent State E State D State F State H State I State G State J Source: NCHS/CDC/National Vital Statistics System
Percent of Records with Not Stated Data for Infections: Revised states, 2003-2006 State A Percent State D State F State B State I State G State J Source: NCHS/CDC/National Vital Statistics System
Percent of Records with Not Stated Data for Mother’s Height Revised States, 2003-2006 State A Percent State B State C State D State E State G State F State H State I State J Source: NCHS/CDC/National Vital Statistics System
Percent of Records with Not Stated Data For Receipt of WIC Food, Revised states, 2004-2006 04 05 06 04 05 06 04 05 06 04 05 06 04 05 06 04 05 06 04 05 06 State A State B State C State D State E State F State G Source: NCHS/CDC/National Vital Statistics System
Percent of records with not stated data for “Source of Payment:” Revised states, 2004-2006 04 05 06 04 05 06 04 05 06 04 05 06 04 05 06 04 05 06 04 05 06 State A State B State C State D State E State F State G Source: NCHS/CDC/National Vital Statistics System
Average Lag in Days Between Reporting Period and Receipt of Data at NCHS by Year Revised (150-301)* (25-176)* (10-192)* (12-38)* (5-51)* NOTE: *range of days
A B E C D PA PA W/O PA W/O is state rate without 5 targeted facilities
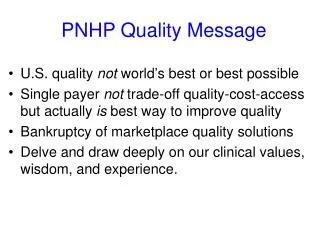
Wine or Vinegar? • Overall levels of unknowns for most areas are acceptable, but • They can vary widely by state AND, more importantly… • Unknowns generally decline for all areas following the first year of implementation • Timeliness also tends to improve quite dramatically following the first year of revision • Timeliness was much improved for states which revised in 2006-2007 compared with those that revised 2003-2005.
Improving the Vintage • Look at individual facilities to see if there are any major outliers and work with those facilities to improve the unknown rates. • Does it appear all facilities are having high unknowns in certain items? If so, • Can the birth clerk/registrar find the information in the records? • Is there a problem with the wording of the item? • Do you need to do more education on the item? • Do facilities and parents understand the importance of the data? • Is there a problem with the software if using an electronic birth certificate system?
Marina O. Matthew, RHIA Director, Division of Statistical Registries Bureau of Health Statistics and Research 555 Walnut Street, 6th Floor Harrisburg, PA 17101 (717) 783-2548 mmatthew@state.pa.us Website: www.health.state.pa.us Joyce A. Martin, M.P.H. Lead Statistician Reproductive Statistics Branch Division of Vital Statistics National Center for Health Statistics (301) 458-4362 JAMartin@cdc.gov For More Information: