Download

1 / 27
270 likes | 408 Views
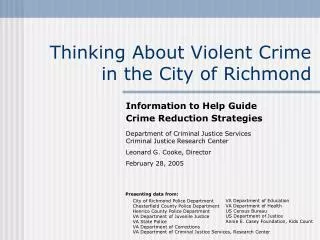
Thinking About Violent Crime in the City of Richmond. Information to Help Guide Crime Reduction Strategies. Department of Criminal Justice Services Criminal Justice Research Center Leonard G. Cooke, Director February 28, 2005. VA Department of Education.

E N D
Thinking About Violent Crime in the City of Richmond Information to Help Guide Crime Reduction Strategies Department of Criminal Justice Services Criminal Justice Research Center Leonard G. Cooke, Director February 28, 2005 VA Department of Education City of Richmond Police Department VA Department of Health Chesterfield County Police Department US Census Bureau Henrico County Police Department US Department of Justice VA Department of Juvenile Justice Annie E. Casey Foundation, Kids Count VA State Police VA Department of Corrections VA Department of Criminal Justice Services, Research Center
Thinking About Violent Crime in Richmond We’ve gathered information from a broad range of sources, in an effort to try to capture the big picture. We’re not saying that we have the solution to Richmond’s crime problem. In fact, it’s likely that there isn’t one single solution. Our goal at this stage is to prompt discussions that could lead to a comprehensive response to violent crime in Richmond.
Richmond and Comparison LocalitiesPopulation Size – Census 2000 • This presentation compares Richmond to its bordering counties and to major cities in the Eastern, Northern, and Western regions of the state. Data Source: U.S. Census Bureau Website
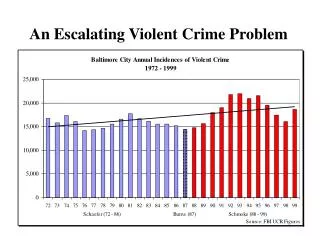
Violent Crime Rate1975-2003 • Richmond has historically had much higher violent crime rates than other localities. • Richmond’s violent crime rate began a long upward trend in 1979. • As in many localities, Richmond’s violent crime rate declined during the late 1990s. Data Source: Va. State Police (Crime in Virginia 2003), and DCJS Research Center
Violent CrimeRate of Murder, Rape, Robbery, and Aggravated Assault Incidents and Arrests, CY 2003 • Richmond has the highest violent crime incident rate and the highest violent crime arrest rate among these localities. Data Source: Va. State Police (Crime in Virginia 2003), and DCJS Research Center
Violent Crime & Police ManpowerCY 2003 • Richmond’s police force (number of sworn officers) is disproportionately low relative to its violent crime problem, when compared to the other localities. Portsmouth faces a similar problem. Data Source: Va. State Police, Crime in Virginia 2003; U.S. Dept. of Justice, Crime in the U.S. 2003; DCJS Research Center
Manpower: ‘Cops & Robbers’DOC Prisoner Releases and Commitments vs Richmond Police Officers • Richmond’s four-year increase in the former convict population is almost 40% higher than its number of police officers in 2003. • Richmond also had over 2,300 active probation cases in January 2005. *Locality is based on committing court. Some released prisoners do not return to the district from which they were committed. Data Source: Va. State Police (Crime in Virginia 2003), Department of Corrections
Juvenile RecidivismFY 2000-2003 • Two-thirds of Richmond juveniles released from state juvenile correctional centers (JCCs) between 2000 and 2003 were rearrested for a felony or misdemeanor within one year of release. *Includes Colonial Heights. Data Source: Va. Dept. of Juvenile Justice, 2004 Data Resource Guide
The Link Between Crime and Socioeconomic Conditions Crime reduction involves more than just traditional criminal justice approaches. Social and “quality of life” factors are also important. Research has consistently demonstrated that high violent crime rates are associated with other indicators of social disruption. The charts that follow show how this relationship takes place in the City of Richmond.
Births to Single MothersCY 2003 • In Richmond, over 60% of babies are born to single mothers. • Richmond has the highest teen pregnancy rate among these localities (98.5 per 1,000 girls age 15-17). • Richmond had twice as many abortions as Alexandria, and 5 to 10 times as many as any of the other localities, in 2003. Data Source: Virginia Dept. of Health, 2003 Health Profiles
Infant HealthInfant Mortality (2003), Low Birth Weight Babies (2003), Birth Defects (1989-98) • Richmond’s rate of low birth weight babies (about 5.5 lbs or less) was higher than other counties and cities. Richmond’s birth defect rate and rate of infant mortality (deaths within 12 months of birth) were second only to Roanoke’s. • Richmond’s infant mortality rate was 14.3 per thousand in 2003, down from 18.5 per thousand in 2001. Data Source: Virginia Dept. of Health, 2003 Health Profiles
Children in Foster CareCY 2001 • Children who have been in foster care are at higher risk for dropping out of school, teen pregnancy, long-term unemployment, and incarceration. Data Source: Voices for Virginia’s Children, 2003 Virginia Kids Count Book
Lead Poisoning Rate Children age 0-14 years, by Health District, CY 2003 • “Childhood lead poisoning has been associated with increased risk of attention deficit disorder, developmental delays, reduced educational attainment and lifelong income levels, as well as increased risk for juvenile delinquency.” – Va. Dept. of Health, Healthy Virginia Communities, 1997 • Blood lead levels have been found to be significantly higher in delinquent youth. • Richmond’s lead poisoning rate is highest in the state. It is more than four times higher than Roanoke’s, which is second highest in the state. *Rates per 100,000 children age 0-14 reported with blood lead levels > 10 g/dl **Includes Powhatan and Colonial Heights Data Source: Virginia Dept. of Health, 2003 Annual Report Summary of Surveillance Data
School OffensesSelect Discipline, Crime, and Violence Incidents for 2002-03 • Richmond public schools had the highest combined number of fighting, sexual offenses, threat/intimidation, and weapons incidents in the state. Data Source: Virginia Dept. of Education, 2002-03 Superintendent’s Report
High School GraduationGraduation Rates and Post-Graduation Plans, School Year 2003-04 • Almost half of the students who were in 9th grade in Richmond in 2000 did not graduate in 2004. • Of those who did graduate, 36% had no plans for employment, continuing education, or military service after graduation. • Richmond schools consistently have the lowest Standards of Learning passing rates among these localities. Data Source: Virginia Dept. of Education, 2003-04 Superintendent’s Report
Social scientists generally agree that unemployment, especially persistent unemployment, leads to individual poverty and that residential concentrations of poverty lead to higher crime. National Institute of Justice, Research Preview
Adult Educational AttainmentAdults 25 and older with no high school diploma, CY 2000 • A quarter of adults age 25 or older in Richmond do not have their high school diploma (or equivalent). Data Source: U.S. Census Bureau, Census 2000, Table DP-2
Unemployment RateCY 2003 • Richmond’s 2003 unemployment rate was the highest of these localities. Data Source: Annie E. Casey Foundation, Kids Count Data
Poverty: Adults & Children in FamiliesCY 1999 • More than one in six adults in Richmond live in poverty. • About one in three children in Richmond live in poverty. • Two-thirds of Richmond students were approved for a free or reduced-cost school lunch. • Richmond’s median income for families with children is lower than in the comparison localities. Data Source: U.S. Census Bureau, Census 2000, Table DP-3
Poverty and Community MobilityCensus 2000 • Communities characterized by both poverty and high mobility are more likely to experience high violent crime rates than mobile areas that are more affluent, or poor areas that are more stable. • Richmond had the highest level of poverty and the second highest percentage of households turning over within one year. Data Source: U.S. Census Bureau, Census 2000, Tables DP-3 and DP-4
Summary: The Link Between Richmond’s Violent Crime and Socioeconomic Conditions • Richmond’s violent crime rate is far above other localities’. • Richmond suffers from a number of socioeconomic stressors: • High rate of children raised in single parent families or foster care • High rate of infant health problems, including infant mortality • Very high rate of blood poisoning among children • High number of violent incidents in school • Low graduation rates • High levels of unemployment, poverty, and community mobility • Research and common sense indicate that these socioeconomic factors contribute to violent crime.
Homicide, Forcible Sexual Offense, Robbery, and Aggravated AssaultIncidents per 1,000 in population in 2003, by Census Tract Violent Crime Across Richmond
Social Factors Census 2000 Data, by Census Tract Violent Crime Single Mother HouseholdAs a percentage of all families Adults Over 25 with no H.S. Diploma or GEDAs a percentage of all adults over 25 Mobility Rate Percent moved to home in past year Children Under 5 in Poverty As a percentage of all children under 5
Violent Crime RateRichmond, Chesterfield, and Henrico Homicide, Sex Offense, Robbery, and Assault Incidents per 1,000 in population in 2003, by Census Tract The counties’ violent crime problems tend to be concentrated in areas bordering the city.
Summary: Violent Crime and Socioeconomic Stressors Within Richmond – Census Tract Maps • Richmond’s violent crime and socioeconomic stressors are not evenly spread throughout the city. • Some areas have high levels of education and income and low levels of violent crime. • Other areas have low education and income and high violent crime rates. • Violent crime rates and socioeconomic stressors follow a clear pattern in the city. • Although Richmond has much higher violent crime rates than surrounding counties, those parts of the counties that border the city tend to have more violent crime.
What does it all mean? These findings suggest that a multidisciplinary, regional approach may be necessary to have a substantial, long-term impact on Richmond’s violent crime problem. DCJS would welcome the opportunity to assist the City of Richmond in identifying and implementing such an approach. The criminal justice system must be more proactive in influencing anti-poverty, community revitalization, family and educational programs and policies. -National Institute of Justice, Research Forum It’s not just a Richmond problem, it’s a metropolitan problem. - Mayor-elect Wilder, speaking on the need for a regional approach to combating crime
Baron Blakley DCJS Criminal Justice Research Center 804.786.3057 baron.blakley@dcjs.virginia.gov