LUNG MECHANICS
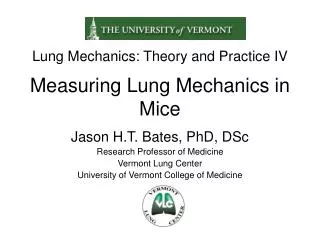
BASELINE. POST CHALLENGE. Frequency(Hz). Tracer Activity. Correlation of Lung Mechanics and Ventilation with Positron Emission Tomography During Bronchoconstriction

LUNG MECHANICS
E N D
Presentation Transcript
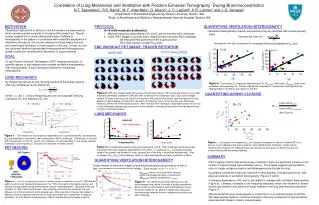
BASELINE POST CHALLENGE Frequency(Hz) Tracer Activity Correlation of Lung Mechanics and Ventilation with Positron Emission TomographyDuring Bronchoconstriction N.T. Tgavalekos1, R.S. Harris2, M. F. Vidal Melo2, G. Musch2, J. D. Layfield2, K.R. Lutchen1 and J. G. Venegas2 1Department of Biomedical Engineering, Boston University, Boston, MA 2Dept. of Anesthesia and Medicine, Massachusetts General Hospital, Boston, MA MOTIVATION PROTOCOL QUANTIFYING VENTILATION HETEROGENEITY The primary dysfunction in asthma is that the airways are hyperreactive which causes extreme constriction throughout the airway tree. Recent studies suggest that a crucial clinical phenotype of asthma is heterogeneity in the pattern of constriction which amplifies degradation in mechanics throughout the lung by creating functional airway closures and severe hypo-ventilation in some regions of the lung. To date, no one has confirmed whether hypoventilation associated with heterogeneous airway constriction correlates with alterations in lung mechanics. • In 14 mild-moderate asthmatics: • Measure frequency dependence of RL and EL before and after MCh challenge • Collect PET images to quantify tracer retention before and after MCh challenge • Ventilation heterogeneity of whole lung washout may be quantified with a Heterogeneity • Index Heterogeneity Index (HI) = Sfvi(sVi-sV)2 - All measurements performed in the supine position - MCh dose equal to upright PC20 dose. sV Increases in HI will correspond to increased differences between sVfast and sVslow END WASHOUT PET IMAGE: TRACER RETENTION POST CHALLENGE BASELINE GOAL To use Positron Emission Tomographic (PET) imaging techniques, to quantify regions of gas trapping and correlate ventilation heterogeneity, with measurements of lung mechanics sensitive to mechanical heterogeneity LUNG MECHANICS HI HI By measuring pressure across the lung and flow at the airway opening, total lung impedance can be defined as: Figure 6: Correlations of frequency dependence of RL (Rlow-High) (left)and EL(Ehigh-low )(right) with ventilation heterogeneity (HI). Results indicate that increases in mechanical heterogeneity and heterogeneity in ventilation are related (r=.82,.87). Figure 3:PET scan images taken at the end of the washout period. PET scans are shown for one mild-moderate asthmatics at baseline (left) and after a methacholine challenge (right). Each set of images contain 15 slices of the lung, the top left is the apex of the lung and the bottom right the base of the lung. Regions of gas trapping correspond to red colors. At baseline, much of the lung has very little tracer remaining at the end of the washout period. After methacholine challenge, a significant portion of the lung in both asthmatics display large amounts of tracer retention, indicating those alveoli that lay behind close or highly constricted airways QUANTIFYING AIRWAY CLOSURE where = 2f, f = forcing frequency, and one can calculate total lung resistance (RL) and elastance (EL) as: Tracer Activity apnea Tracer Activity end washout RF = (See Figure 2) LUNG MECHANICS Figure 1:The mean level and frequency dependence oflung resistance(RL) and elastance (EL) are amplified in asthmatics after methacholine (MCh) challenge. Differences in low and high frequencies for both RL and EL are indicative of heterogeneities in the airway disease. Increases in low frequency EL may also be indicative of airway closure. Figure 7: Increases in low frequency EL are related to increases in retention fraction(RF), the amount of gas trapped at the end of washout, after methacholine challenge. These results imply that low frequency EL measurements are sensitive to the fraction of alveoli that are not communicating with the airway opening. PET IMAGING Figure 4: Corresponding baseline and post challenge RL and EL. Post challenge mechanics reveal increased levels and frequency dependence in RL and EL. In particular, ELow is elevated because some of the airways are allowed to close, causing less of the lung to be probed mechanically. Also increases in RLow-RHigh post challenge, reflect a highly heterogeneous airway constriction pattern. SUMMARY QUANTIFYING VENTILATION HETEROGENEITY • PET imaging confirms that during airway constriction there is a significant increase in the number of regions where hypoventilation occurs. The images suggest hypoventilation occurs in large contiguous regions and heterogeneously through the lung. • Qualitative mechanical measures sensitive to heterogeneity, increase significantly with physical evidence of ventilation heterogeneity (Figures 3 and 4). • Frequency dependence of RL and EL are related to changes with ventilation heterogeneity (Figure 6). Likewise, increases in low frequency elastance, which are indicative of airway closure, are related to the amount of tracer retained in the lung after bronchoconstriction (Figure 7). • We conclude that acute heterogeneity of constriction is a crucial phenotype of asthma. The heterogeneity leads to functional changes in the lung consequent to hypoventilation associated with closed or nearly closed airways Tracer kinetics of the entire imaged lung during the washout period may be fit with a two compartment exponential decay model : Tracer Activity= fvf*e (-t/tf)+ fvs*e (-t/ts) fvslow,fast: fraction of blood flow to the lung region associated with each compartment sVslow,fast: specific ventilation(1/tslow,fast) Figure 2: The PET imaging technique for human subjects requires a bolus of 13NN labeled saline solution to be injected intravenously. The 13NN is forced into the saline solution and injected into the patient during a short apnea using a “salsa generator”. Because of the low solubility of 13NN in blood and tissues, upon reaching he pulmonary capillaries, the gas diffuses out of the blood and into the alveolar gas. After a period of imaging, the subject is asked to resume breathing and the rate of local tracer wash out corresponds to regional ventilation. In units distal to closed airways 13NN is retained during the washout period Figure 5: The rate at which tracer washes out of the entire imaged lung can be fit be with a double exponential decay model for both baseline and post challenge curves. From this model we can define a relationship comparing the differences between the two compartments before and after challenge
AIRWAY CLOSURE AND HETEROGENITY POST CHALLENGE HETEROGENITY HETEROGENITY BASELINE Frequency(Hz)
sVfast sVslow TRACER WASHOUT: sV = fvf*sVf +fvs*sVs Time (s) APNEA POST CHALLENGE TRACER RETENTION BASELINE TRACER WASHOUT Time (s)
APNEA POST CHALLENGE TRACER RETENTION BASELINE TRACER WASHOUT Time (s)