Download
1 / 25
270 likes | 497 Views
2008 AGU Fall Meeting, San Francisco, CA. Marmot Dam Removal Predictions and Observations. Yantao Cui 1 , Bruce Orr 1 , Andrew Wilcox 2 , Jen Vick 3 , Charles Podolak 4 , and Peter Wilcock 4. Stillwater Sciences, 2855 Telegraph Ave., Berkeley, California

E N D
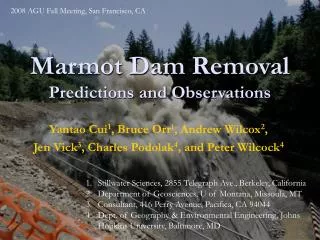
2008 AGU Fall Meeting, San Francisco, CA Marmot Dam RemovalPredictions and Observations Yantao Cui1, Bruce Orr1, Andrew Wilcox2, Jen Vick3, Charles Podolak4, and Peter Wilcock4 • Stillwater Sciences, 2855 Telegraph Ave., Berkeley, California • Department of Geosciences, U of Montana, Missoula, MT • Consultant, 416 Perry Avenue, Pacifica, CA 94044 • Dept. of Geography & Environmental Engineering, Johns Hopkins University, Baltimore, MD
50 km to Portland, Oregon Mt. Hood Drainage Area: 680 km2 at Marmot Dam 1,120 km2 at Bull Run River confluence 1,305 km2 at Columbia River confluence
Key Issues Necessitate Sediment Transport Modeling • Fish habitat • Spawning habitat; • Rearing habitat; • Passage. Piles ~ 600 ft high in a football field! • Home owner – flooding risks.
Modeling Challenges • Coupled modeling of up- and downstream reaches; • Large size range (0.5 – 250 mm); • Stratified sediment deposit; • Large temporal scale (~ 10 years); • Large spatial scale (~50 km).
Model Foundation • Sediment pulse work (Gary Parker, Tom Lisle, Jim Pizzuto, Yantao Cui and colleagues); • Reservoir deposit = sediment pulse, • Sediment pulse model should work for dam removal simulation with some adaptations.
Simulated Dam Removal Alternatives • Blow-and-go; • Two season staged removal; • Dredging prior to dam removal.
Results of Sediment Transport Modeling • Staged two-season removal provides absolutely no benefit; • Dredging 15% of sediment (the max can be dredged in one year) provides minimal benefit in terms of minimizing downstream sediment deposition;
Selection of Dam Removal Option • Because multiple-year dredging is technically unreliable (a winter storm may completely fill in the previous dredging slot) and economically unacceptable, the only sensible dam removal alternative is blow-and-go, provided that modeling results indicated no serious impacts.
Modeling Results • Reservoir erosion starts fast but slowdown after year one; • Not depositing everywhere; • Need a few years.
Modeling Results • Annual change is small except during the first couple of years at selected locations.
Modeling Results • Sand pass through the river quickly to the Columbia River; • Sand deposition is minor and near mouth.
Modeling Results • DTSS < 500 ppm; • Spikes associated with storm events; • Fish ok!
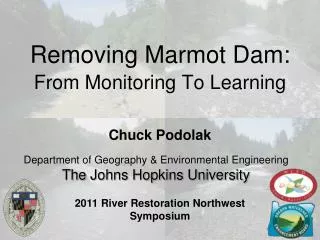
NCED Field Measurements • 4 years • Summer 2007-Summer 2010 • Repeat Surveys • Deposit Volume • Deposit Location • Pebble counts • Surface GSD Chuck’s play ground! PGE survey for end point analysis! LiDAR survey in 2006, 2007 and 2008.
Comparisons with Observations One Year After Removal The quick initial erosion of the reservoir deposit without forming a head-cut; Low TSS except in the first few hours (Major et al. 2008 EOS Transactions); Deposition in Reach 1, almost nothing further downstream.
Reservoir Area Note: modeling results (lines) used discharge record of a wet, an average, and a dry year as model input, providing three different predictions.
PGE survey data Average year Wet year Dry year Note: modeling results (lines) used discharge record of a wet, an average, and a dry year as model input, providing three different predictions.
NCED Field Measurements (C. Podolak) • Wedge in upper part of reach 1 • No measurable deposition in study areas in reaches 2, 3 or 4 • No measurable change in GSD in downstream reaches Marmot Dam (14.7 m tall) (Note: simulation results are based on average hydrologic condition.)
Perspective Not much change beyond this reach. Primary concern here was fish passage. Primary spawning habitat. The deposit was allowed to go downstream because modeling results indicated not much will occur here. All the signs to date show that modeling results will remain true in the future, but we may want to wait for a few years before we can give the prediction a final verdict.
Jan 26, 2008 850 cfs Jul 5, 2007 587 cfs Nov 17, 2008 1150 cfs Nov 14, 2008 2800 cfs
Final Remarks Chapter 23 Sedimentation Engineering, ASCE Manual 110, M.H. Garcia Ed. www.stillwatersci.com
Acknowledgement • Funding from Portland General Electric (PGE); • Helpful discussions with Tom Lisle and Bill Dietrich during modeling; • Support and help from PGE and Stillwater Sciences staff; • Review of modeling report by Bill Dietrich, Marcelo Garcia, Tom Lisle, Jim Pizzuto, and Steve Wiele.