Download
1 / 57
570 likes | 723 Views
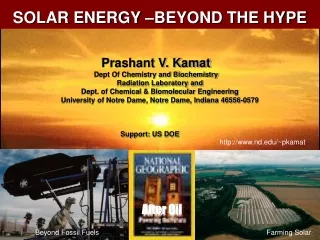
After Oil. After Oil. Beyond Fossil Fuels. Farming Solar. The Clean Energy Challenge. Prashant V. Kamat Radiation Laboratory and Dept Of Chemistry and Biochemistry Dept. of Chemical & Biomolecular Engineering University of Notre Dame, Notre Dame, Indiana 46556-0579.

E N D
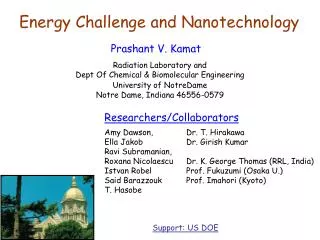
After Oil After Oil Beyond Fossil Fuels Farming Solar The Clean Energy Challenge • Prashant V. Kamat • Radiation Laboratory and • Dept Of Chemistry and Biochemistry • Dept. of Chemical & Biomolecular Engineering • University of Notre Dame, Notre Dame, Indiana 46556-0579 Support: US DOE, US Army & Indiana 21st Century
I The Energy Challenge II Nanotechonolgy to the rescue (?) Catalysis with Nanoparticles Solar Cells and Fuel Cells
Humanity’s Top Ten Problemsfor next 50 years • ENERGY • WATER • FOOD • ENVIRONMENT • POVERTY • TERRORISM & WAR • DISEASE • EDUCATION • DEMOCRACY • POPULATION 2004 6.5 Billion People 2050 ~ 10 Billion People ….. R. Smalley, Rice Univ.
Chemical Nuclear Mechanical Energy Energy sources The first derives from chemical or photophysical energy that relies on oxidizing some reduced substance, usually a hydrocarbon, or absorbing sunlight to generate either heat or electricity. The energy involved is that of a chemical bond or fractions of an electron volt (eV). The second involves nuclear reactions that release energy either by splitting heavy nuclei or by fusing light nuclei. The energy involved in nuclear reactions is in the region of 106 electron volts (MeV) per nuclear reaction. The third is thermomechanical in the form of wind, water, or geological sources of steam or hot water. The energy involved is in the milli-electron-volt (meV) region from, for example, water falling several tens of meters.
Energy Flow Diagram for the US Energy flow diagram for the United States for 1999, in quads (1 quad = 1015 British thermal units = 2.92x10¹¹ kWh). The average energy consumption in the United States is 0.42x10⁻⁶ quads per person per year, and the US population is about 5% of that on planet Earth. Energy consumption is large compared with food consumption (1.22x10⁴ kJ per day per person , which translates to only 0.42x10⁻⁸ quads per person per year). Some corresponding numbers for world energy consumption for 1999, in quads, are: petroleum 149.7; natural gas 87.3; coal 84.9; nuclear 25.2; hydro, geothermal, solar, wind and other renewables 29.9; total world energy production is 377.1 quads. Energy Information Administration Office of Energy Markets and End Use. Annual Energy Review 1999 <http://www.eia.doe.gov/aer> (US Department of Energy, Washington DC, 2000); Dresselhaus, M. S. and Thomas, I. L., Alternative energy technologies. Nature, 2001, 414, 332-337
Uppsala Hydrocarbon Depletion Study GroupOIL AND GAS LIQUIDS 2004 Scenario http://ww.peakpoil.net
Light Crude Oil (CL, NYMEX)Monthly Price Chart Increasing demand is driving oil prices higher http://politicalhumor.about.com
News Quotes from April 01, 2005** 9 a m U.S. used an average of 8.9 million barrels of gasoline a day this year, up 2.2 percent from the same period in 2004, Energy Department data shows. Goldman Sachs predicted a "super spike" in oil prices, to $105 a barrel by 2007. The forecast helped push oil futures prices sharply higher. "With OPEC capacity only a million barrels a day away from their limits and demand rising, add a major outage somewhere and sure it's possible," said Tom Bentz, an analyst at BNP Paribas Commodity Futures. Gasoline prices would have to reach $4 a gallon to stop American consumers from driving gas-guzzling vehicles, Goldman Sachs concludes. 5 p m Oil prices rallied to a record close above $57 a barrel Friday, sparked by a surge in gasoline futures that could send the average retail cost of gasoline above $2.25 a gallon within a few weeks. ** Note: These are not April Fool Jokes! These are real news clips of the day
THE END OF CHEAP After Oil Oil The U.S. tax code offers a $2,000 consumer credit for hybrid car owners and a deduction of up to $100,000 for people who buy the largest SUVs for business use! …..It's inevitable. But just how soon will the vital fuel become so scarce and expensive that we're forced to make hard choices about how we live? …Some experts, in fact, think the world production peak is already here. The timing rests largely on the actions of Middle East producers and on moves to conserve and to develop unconventional sources.
Graph: World Oil Production 1950-2050 Source: Dr. C.J. Campbell "Understanding depletion is simple. Think of an Irish pub. The glass starts full and ends empty. There are only so many more drinks to closing time. It’s the same with oil. We have to find the bar before we can drink what is in it." Campbell
The old way to address the problem ……. New York Times April 25, 2005 But will it work this time? Saudis are already pumping oil at rates closer to their maximum sustainable capacity than during previous price spikes, leaving them less leeway to increase the supply on the global market. In 2002 Saudi Aramco, the state owned oil company, says it produced 6.8 million barrels of oil per day. The Saudis now produce about 9.5 million barrels a day. The spare capacity available to the Saudis is estimated to be down to about 1.2 million barrels a day.
Global warming over the past millennium Very rapidly we have entered uncharted territory -– what some call the anthropocene climate regime. Over the 20th century, human population quadrupled and energy consumption increased sixteenfold. Near the end of the last century, we crossed a critical threshold, and global warming from the fossil fuel greenhouse became a major, and increasingly dominant, factor in climate change. Global mean surface temperature is higher today than it’s been for at least a millennium. …… Marty Hoffert NYU
This shift is hard to explain without attributing it in part to human-caused global warming ….. National Snow and Ice Data Center in Boulder, CO. (NY Times, Sept 29, 2005 )
Environmental Impact of Rise in Global Temperature Oceans getting warmer. A measure of regional storm activity. Annual mean SST anomalies relative to 1961 to 1990 ( 23) for 1870 to 2004, averaged over the tropical Atlantic (10°N to 20°N, excluding the Caribbean west of 80°W) (top) and the extratropical North Atlantic (30°N to 65°N) (bottom). Heavy lines are 10-year running means. The ACE index reflects the collective intensity and duration of tropical storms and hurricanes during a given hurricane season. Values are given as percentage of the median from 1951 to 2000; the white band indicates normal conditions, the blue is below normal, and the pink is above normal, according to NOAA. Kevin Trenberth.Science 38, 1753 (17 Jun 2005)
Forecasters could run out of names from the list of 21 for tropical storms and hurricanes before the 2005 season ends November 30.Only four names left for the year! 2005
Beyond 2010 new carbon-free primary power technologies will increasingly be needed (~10TW by 2050) The United Nations Framework Convention on Climate Change calls for ‘‘stabilization of greenhouse-gas concentrations in the atmosphere at a level that would prevent dangerous anthropogenic interference with the climate system . . .’’. A standard baseline scenario that assumes no policy intervention to limit greenhouse-gas emissions has 10 TW (10 x 1012 watts) of carbon-emission-free power being produced by the year 2050, equivalent to the power provided by all today’s energy sources combined. …………….NATURE, VOL 395, 881,1998 Decarbonization, CO2 sequestering …. Improved energy efficiency in motor vehicles, buildings and electrical appliances
Three possible options for meeting the 10 TW- Challenge by 2050 Carbon Neutral Energy (fossil fuel inconjunction with carbon sequestration) -Need to find secure storage for 25 billion metric tons of CO2 produced annually (equal to the volume of 12500 km3 or volume of lake superior!) Nuclear Power -Requires construction of a new one-gigawatt-electric (1-GW) nuclear fission plant everyday for the next 50 years Renewable Energy Sources - hydroelectric resource 0.5 TW - from all tides & ocean currents 2 TW - geothermal integrated over all the land area 12 TW - globally extractable wind power 2-4 TW - solar energy striking the earth 120,000 TW !!!
The Silver Lining ……. • The earth receives more energy from the sun in just one hour than the world uses in a whole year. • Cumulative solar energy production accounts for less than 0.01% of total Global Primary Energy demand. • Solar Energy demand has grown at about 25% per annum over the past 15 years (hydrocarbon energy demand typically grows between 0-2% per annum). Worldwide photovoltaic installations increased by 927 MW in 2004, up from 574 MW installed during the previous year. • An average crystalline silicon cell solar module has an efficiency of 15%, an average thin film cell solar module has an efficiency of 6%.(Thin film manufacturing costs potentially are lower, though.) • Solar Energy (photovoltaic) prices have declined on average 4% per annum over the past 15 years. • For the Fiscal Year 2002, the Japanese solar roof top program received applications from 42,838 households. • Without incentive programs, solar energy costs (in an average sunny climate) range between 22-40 cents/kWh for very large PV systems. (installation costs $8-$10 with no government incentives) • Japan has taken over from the United States as the largest net exporter of PV cells and modules. Around 50 % of the world's solar cell production was manufactured in Japan in 2003. United States accounted for 12%. www.solarbuzz.com
Reflection 30% 173, 000 TW Long Wavelength Radiation Winds Waves Convection <1% (370 TW) Tidal Volcanic 3 TW Evaporation Storage in water/ice 23% Conversion to Heat 47% Storage in plants <1% (40TW) EARTH 30TW Fossil Fuels Thermal, Nuclear Solar Energy Cycle
PV Land Area Requirements Six boxes showing land area requirements to produce 20 TW of photovoltaic energy at 10% efficiency.
Boxes showing land area requirements to produce 3 TW or 20 TW of photovoltaic energy at 10% efficiency.
Hoffert et al., Advanced Technology Paths to Global Climate Stability: Energy for a Greenhouse Planet.2002, 298, 981-987. Mass-produced widely distributed PV arrays and wind turbines making electrolytic H2 or electricity may eventually generate 10 to 30 TW emission-free. The global grid proposed by R. Buckminster Fuller with modern computerized load management and high-temperature superconducting (HTS) cables could transmit electricity from day to night locations
Need for alternative energy sources –Solar Energy Overcome the environmental issues –Greenhouse effect Decrease the cost per watt by improving the efficiency –solar paint, flexible cells Efficiency of Photovoltaic Devices Margolis, Science 285, 690, 1999)
Photoelectrochemical Cell Low surface area Higher cost Higher efficiency Single Crystal Semiconductor Solar-Driven Photoelectrochemical Water Splitting H2 O2 Glass or plexiglass Aqueous electrolyte High surface area Low cost Low efficiency H2 O2 Stainless steel or conducting plastic Porous membrane Photoelectrochemical cells Polycrystalline or nanostructured films
ECB e EF EVB h – CB – et + ht Red + VB Ox hn 1. Semiconductor Assisted Catalysis Single Crystal versus Nanoparticle Issues: Charge separation and charge transport
Hydrogen Evolution rates for various Photocatalysts (ml/hr) Pt/TiO2 7.7 Pd/TiO2 6.7 Rh/TiO2 2.8 Ru/TiO2 0.2 Sn/TiO2 0.2 Ni/TiO2 0.1 TiO2 <0.1 – CB – e 2H+ t h t + hn + 4OH- VB Issues: 2H2O+ O2 What about gold and other noble metals? - Explore size dependent properties of nanometals and alloys How to extend the response into the visible? - Design new photocatalysts and composites How to improve the photocatalytic efficiency? -Understand the charge transfer processes at the interface Toshima, J. Phys. Chem. 1985, 89, 1902 H2 2H+ Pt Semiconductor (e.g., TiO2) nanoparticles for hydrogen production
V vs. NHE -2.0 SIC CB GaAs CdS -1.0 CdSe TiO2 MoS2 3.0 Fe2O2 H+/H2 1.4 0.0 In2O3 1.7 WO3 2.4 1.2 CdO +1.0 3.0 2.2 VB 2.7 2.8 2.1 eV Eg +2.0 +3.0 Band Edge and Energetic Considerations
2. SOLAR CELLS Efficiency Compared with Cost Per Unit Area of PV Devices (The diagonal lines show installed 2001 price of modules per peak-watt. The theoretical limit for Shockley-Queisser devices [present limit] is 32 Third generation devices [shown in red] may exceed this limit by using multiple absorbers, hot carrier effects, or photocurrent doubling via impact ionization. The latter two phenomena are associated with quantum size effects in semiconductors and are being studied in semiconductor nanocrystals). L. Kazmerski, Solar-Electric Power: A 2001 Device Overview, National Center for Photovoltaics, National Renewable Energy Laboratory, Golden, CO (2001). M. Green, Annual Report, Third Generation Photovoltaics, University of New South Wales, Sydney, Australia (2000).
100 Thermodynamic limit (Maximum concentration) 80 Thermodynamic limit (One Sun) 60 How to bridge these gaps Efficiency % 40 Existing tandems (concentrator) 20 One-sun Si cell efficiency 0 Time Now A grand Challenge for Solar Cells Innovative technology is essential to bridge the gap between existing photovoltaic devices and the efficiency limits http://www.er.doe.gov/production/bes/reports/list.html
Can we address the clean energy challenge with advances in Nanotechnology?
Commentary Nature Materials, February 2005 To be nano or not to be nano? CHRISTIAN JOACHIM Nanomaterials, nanostructures, nanostructured materials, nanoimprint, nanobiotechnology, nanophysics, nanochemistry, radical nanotechnology, nanosciences, nanooptics, nanoelectronics, nanorobotics, nanosoldiers, nanomedecine, nanoeconomy, nanobusiness, nanolawyer, nanoethics to name a few of the nanos. We need a clear definition of all these burgeoning fields for the sake of the grant attribution, for the sake of research program definition, and to avoid everyone being lost in so many nanos. Galatée aux Sphères (Salvador Dali, 1952). Nanoscience is the study of phenomena and manipulation of materials at atomic, molecular and macromolecular scales, where properties differ significantly from those at a larger scale. …….Royal Society of London report Nanoscience, and Nanotechnology: Opportunities and Uncertainties, 2004
Energy Unoccupied EF Occupied Bulk Semiconductor Atom Particles Density of States Unique Aspects of nanostructures • Organization of molecular-particle composites • 2- and 3-D assemblies • Control of electronic and surface properties • Applications • Optoelectronics, photonics, displays • Chemical and biosensors • Catalysis, photovoltaics and fuel cells
e Au Quantized double layer charging effects Murray et al. Science, 1998, 280, 2098 and Anal. Chem. 1999, 71, 3703 Quantized conductance through individual rows of suspended gold atoms H. Ohnishi, Y. Kondo & K. Takayanagi Nature, 395, 780 (1998) DV= [e/CCLU] where e is the electronic charge and CCLU is capacitance (aF) ……...metal core potentials change by >0.1V increments for single electron transfers at the electrode electrolyte interface unit conductance G0= 2e2/h.
Molecular linker TiO TiO2 2 Pt Gold e Molecular Engineering of Inorganic-Organic Hybrid Assemblies Achieving organized assembly of inorganic-organic hybrids may be the key of exploiting the strength of nanomaterials
e hn Electron Donor Fluorophore Au e TiO2 e Conducting electrode -OOC- Inorganic-Organic Hybrid Assemblies for Solar Cells Can a hierarchial organization provide vectorial charge transport?
Particles connected by small molecules Metal capped Particles SC particle Metal, Catalyst Ways to assemble elementary nanoobjects Wire connected to Metal or SC Nanoparticle
Strategies to match the sensitizer response with the solar spectrum Characterization Standard: • power density of 1000 W/m2 • spectral power distribution corresponding to AM1.5 ≡ 1Sun
e S S S S S S S A u S S S S S S S S S hn hn Ag CdSe TiO2 TiO2 reactant products Electrode h e h h e e Nanostructured Hybrid Assemblies Our Approach • Photocatalysis using semiconductor-metal composites • Quantum dot solar cells • SWCNT as the support architecture to improve charge collection efficiency
Example 1 Jakob, M.; Levanon, H.; Kamat, P.V., Charge Distribution between UV-Irradiated TiO2 and Gold Nanoparticles. Determination of Shift in Fermi Level,.Nano Lett. 2003, 3, 353-358. Subramanian, V., Wolf, E. E. and Kamat, P. V., Catalysis with TiO2/Au Nanocomposites. Effect of Metal Particle Size on the Fermi Level Equilibration.J. Am. Chem. Soc., 2004, 126, 4943-4950. Charge Distribution in TiO2-Metal System Hirakawa and Kamat J. Am. Chem. Soc., 2005, 127, 3928-3934
e e Au e h hn a C2H5OH TiO2 C60- f TiO2 TiO2(e) ….(a) c b TiO2(e) + Au TiO2/Au(e) (b) e e TiO2/Au(e) + C60 TiO2/Au+ C60- ..(c-f) Sequential Electron Transfer C60
(b) (c) (c) (a) 5 nm a b 10 nm 5 nm 10 nm No Au 8 nm Au 5 nm Au 3 nm Au Effect of Gold Particle Size on the Catalytic Reduction Efficiency of TiO2 particles Vaidyanathan, Wolf, Kamat J. Am. Chem. Soc., 2004, 126, 4943-4950
Charging and Discharging of Electrons in the Metal Core Hirakawa, T. and Kamat, P. V., Electron Storage and Surface Plasmon Modulation in Ag@TiO2 Clusters. Langmuir, 2004, 20, 5645-5647
Example 2 Dye Sensitized Photochemical Solar Cells Development of SC nanocluster based cells with more than 10% power conversion efficiency. Photon-to-photocurrent efficiency up to 100% has been claimed! Source: http://dcwww.epfl.ch/icp/ICP-2/icp-2.html
Photovoltaic versus Dye sensitization Principle of Dye-sensitized Photochemical Solar Cell M. Grätzel, Nature 2001, 414, 338−344. B. O’Regan, M. Grätzel, Nature 1991, 353, 737−740
Example 3. Photochemical Solar Cells based on Molecular Assemblies (Mimicking photosynthesis using porphyrins and chlorophyll) Molecular clusters formed in mixed solvents exhibit broader absorption bands
e C H 3 N O e hn N C H 3 Red Ox Designing chromophore assemblies that can harvest visible light (Mimicking photosynthesis with donor-acceptor assemblies Photoinduced electron transfer in a donor acceptor dyad Photoinduced electron transfer between excited donor and acceptor molecules in a cluster assembly near the electrode surface Issues How to harvest photons from a wide spectral range? - Develop new photochemical systems that respond in IR How to improve the efficiency beyond the limit of 10-12%? - Design ordered assemblies of molecules and particles - Improve photoinduced charge separation
H2P C60 + toluene Electro- deposition Formation of micro-crystallites by Slow evaporation of solvent Preparing Self Assembled Molecular Clusters Hasobe, Fukuzumi, KamatJ. Mater. Chem., 2003, 13, 2515 – 2520; and J. Phys. Chem. B, 2003, 107, 12105 – 12112 Nanoclusters (H2P+C60)n
Photoinduced charge separation in H2P-C60 clusters results in photocurrent generation Red Ox Charge Seperation and Charge Propagation in Cluster Films hn