Download
1 / 58
580 likes | 602 Views
Explore the shift towards solar energy post-oil era, with insights on depletion, clean coal tech, and CO2 emissions management. Discover the urgency to adopt sustainable energy solutions amid the climate crisis.

E N D
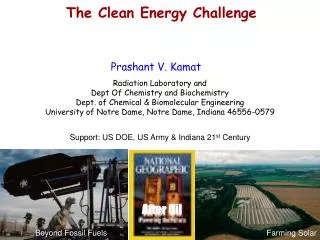
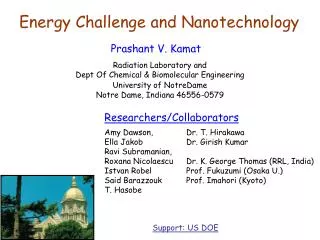
SOLAR ENERGY –BEYOND THE HYPE After Oil After Oil Beyond Fossil Fuels Farming Solar • Prashant V. Kamat • Dept Of Chemistry and Biochemistry • Radiation Laboratory and • Dept. of Chemical & Biomolecular Engineering • University of Notre Dame, Notre Dame, Indiana 46556-0579 Support: US DOE http://www.nd.edu/~pkamat
Where we get our energy from? Update: May 22, 2008 http://tonto.eia.doe.gov/state/
M. King Hubbert Hubbert’s Peak February 4, 1949, Vol 109 SCIENCE 109 ….. Sixty Years Ago Oil is a finite resource; there are basic laws which describe the depletion of any finite resource: http://www.hubbertpeak.com/ • Production starts at zero; • Production then rises to a peak which can never be surpassed; • Once the peak has been passed, production declines until the resource is depleted.
……… and Now "Depletion has built a chasm between the Natural Scientist, who observes nature and applies its immutable physical laws, and the Flat-Earth Economist, who thinks that investment creates resources under ineluctable laws of supply and demand." Campbell Oil & Gas Journal. Tulsa: Jul 14, 2003. Vol. 101, Iss. 27; pg. 38 World Oil Production vs. Discovery Source: Dr. C.J. Campbell
Oil Officials See Limit Looming on Production By RUSSELL GOLD and ANN DAVIS November 19, 2007; Page A1 A growing number of oil-industry chieftains are endorsing an idea long deemed fringe: The world is approaching a practical limit to the number of barrels of crude oil that can be pumped every day. Some predict that, despite the world's fast-growing thirst for oil, producers could hit that ceiling as soon as 2012. Oil production has averaged a 2.3% annual growth rate since 1965 Production from proven fields will decline 4.5% a year. Mr Simmons* thinks a more realistic rate of decline is 8% to 10% a year especially because modern technology actually succeeds in depleting fields faster. Since 1990, despite billions in new spending, the industry has found only one new field with the potential to top 500,000 barrels a day, Kazakhstan's Kashagan field in the Caspian Sea. * Chairman of energy investment banking firm Simmons & Co. International. Exploration http://online.wsj.com/article/SB119543677899797558.html?mod=todays_us_nonsub_page_one
MOTIVATION FOR SOLAR ENERGY RESEARCH Increasing demand is driving oil prices higher http://politicalhumor.about.com
Can we sustain an exponential growth in energy demand? Intensity of the Sun = 1.2x10⁵ TW Worldwide energy consumption I0 = 12 TW (or 0.01% Sun) Q. If demand for energy increases at a rate of 3% per year, how long it will take to match the energy that we receive from the sun? We will have answer at the end of this presentation
The approach so far is to look for more fossil fuels! www.solarsales.com.au
Why not Coal? http://www.ecoworld.com/ Coal provides nearly 50% of the electrical generating fuel in the United States and similar percentages apply around the world. Coal is more abundant than oil, if fact, coal reserves are far more abundant than oil reserves. Coal burning is creating serious air pollution around the world, and with coal production rising with no end in sight, not just carbon dioxide but more immediate and deadly pollutants should be cleaned out of the burning process. This is why we need clean coal technology
http://www.ecoworld.com/ ユ Carbon Capture and Sequestration (CCS) Involves capturing CO2 gases and transporting them to geological storage sites ユ Integrated Gasification Combined Cycle (IGCC) Involves CO2 capture and lower emissions of SO2and NOx ユ Fluidized Bed Combustion (FBC) technology utilizes low grade, variable quality coal plus biomass and municipal waste to meet emissions requirements Clean coal is feasible but expensive Mounting Costs Slow the Push for Clean Coal http://www.nytimes.com/2008/05/30/business/30coal.html?hp
COUNTRIES WITH HIGHEST CO2-EMITTING POWER SECTORS (TONNES PER YEAR) NATURE|Vol 450|22 November 2007, p327 • The city of Taichung in Taiwan is home to a power plant that emits more than 37 million tons of carbon dioxide into the atmosphere each year, the highest of any plant in the world. • Australia produces more carbon dioxide per capita through electricity generation than any other nation. • US power sector still produces the most carbon dioxide in terms of sheer volume.
Global warming over the past millennium Very rapidly we have entered uncharted territory -– what some call the anthropocene climate regime. Over the 20th century, human population quadrupled and energy consumption increased sixteenfold. Near the end of the last century, we crossed a critical threshold, and global warming from the fossil fuel greenhouse became a major, and increasingly dominant, factor in climate change. Global mean surface temperature is higher today than it’s been for at least a millennium. …… Marty Hoffert NYU
The United Nations Framework Convention on Climate Change calls for ‘‘stabilization of greenhouse-gas concentrations in the atmosphere at a level that would prevent dangerous anthropogenic interference with the climate system . . .’’. A standard baseline scenario that assumes no policy intervention to limit greenhouse-gas emissions has 10 TW (10 x 1012 watts) of carbon-emission-free power being produced by the year 2050, equivalent to the power provided by all today’s energy sources combined. …………….NATURE, VOL 395, 881,1998
Carbon Neutral Energy (fossil fuel in conjunction with carbon sequestration) -Need to find secure storage for 25 billion metric tons of CO2 produced annually (equal to the volume of 12500 km3 or volume of lake superior!) Nuclear Power -Requires construction of a new one-gigawatt-electric (1-GW) nuclear fission plant everyday for the next 50 years Renewable Energy Sources - hydroelectric resource 0.5 TW - from all tides & ocean currents 2 TW - geothermal integrated over all the land area 12 TW - globally extractable wind power 2-4 TW - solar energy striking the earth 120,000 TW !!! Three possible options for meeting the 10 TW- Challenge by 2050
Energy (eV) 4 3 2 1 290 1200 Effective Utilization of Solar Photons Wavelength (nm) Wavelength, nm
E = hc/l = 119627/ (kJ/mole) Electricity Generation Heating Photosynthesis Photovoltaics Food/Fuel Solar Energy E=hn Photoconversion Thermal Conversion Energetic Visible Photons Infrared Photons
Photosynthesis Photosynthesis is the process by which plants, some bacteria, and some protistans use the energy from sunlight to produce sugar, which cellular respiration converts into ATP, the "fuel" used by all living things. The conversion of unusable sunlight energy into usable chemical energy, is associated with the actions of the green pigment chlorophyll. Most of the time, the photosynthetic process uses water and releases the oxygen that we absolutely must have to stay alive. 6H2O + 6CO2 ----------> C6H12O6+ 6O2 http://www.emc.maricopa.edu/faculty/farabee/BIOBK/BioBookPS.html
Alternative Fuels Fuel Alternatives • Biodiesel fuel use is on the rise. • Made from natural, renewable sources (veg oils, animal fats). • Can be used as pure fuel or blended with petroleum • Ethanol is renewable, but currently more expensive than gasoline. • Critics argue that it takes more energy to produce a gallon of ethanol than you will obtain from burning it. • Conflict of Interest: National Corn Growers vs. American Petroleum Institute
Solar Hydrogen Production Photoelectrochemical Production of Hydrogen Low surface area Higher cost Higher efficiency Single Crystal Semiconductor Solar-Driven Photoelectrochemical Water Splitting H2 O2 Glass or plexiglass Aqueous electrolyte High surface area Low cost Low efficiency H2 O2 Stainless steel or conducting plastic Porous membrane Photoelectrochemical cells Polycrystalline or nanostructured films
Honda Solar Station for Clean Hydrogen Production http://www.honda.com/solar-cell/ Solar-powered water electrolyzing hydrogen station is operating on an experimental basis since 2001 at Honda R&D Americas, Torrance, California.
Photovoltaics The energy of the absorbed light is transferred to electrons in the atoms of the PV cell. With their newfound energy, these electrons escape from their normal positions in the atoms of the semiconductor PV material and become part of the electrical flow, or current, in an electrical circuit. http://www1.eere.energy.gov/solar/multimedia.html
Timeline 1839 Edmond Becquerel discovered the process of using sunlight to produce an electric current in a solid material. But it took more than another century to truly understand this process. Scientists eventually learned that the photoelectric or photovoltaic (PV) effect caused certain materials to convert light energy into electrical energy at the atomic level. • 1905 • Albert Einstein publishes his paper on the photoelectric effect, along with a paper on his theory of relativity.-Nobel Prize was awarded for this discovery in 1921 • 1954 • Photovoltaic technology is born in the United States when Daryl Chapin, Calvin Fuller, and Gerald Pearson develop the silicon photovoltaic (or PV) cell at Bell Labs—the first solar cell capable of generating enough power from the sun to run everyday electrical equipment. Bell Telephone Laboratories then produces a silicon solar cell with 6% efficiency and later, 11% efficiency. See the California Solar Center for more information. http://www.eere.energy.gov
Timeline In Spring 2002, largest solar electric system in the US began operating a top the Santa Rita Jail in Dublin, California. This solar installation, helps Alameda County reduce and stabilize energy costs. • 1964 • NASA launches the first Nimbus spacecraft—a satellite powered by a 470-watt photovoltaic array. See NASA's Nimbus Program for more information. • 1970 • Exxon Corporation & Dr. Elliot Berman designs a significantly less costly solar cell, bringing the price down from $100 per watt to $20 per watt. Solar cells begin powering navigation warning lights and horns on offshore gas and oil rigs, and railroad crossings. • 1980 • ARCO Solar becomes the first company to produce more than 1 megawatt (a thousand kilowatts) of photovoltaic modules in one year. • 1993 • Pacific Gas & Electric installs the first grid-supported photovoltaic system in Kerman, California. The 500-kilowatt system is the first "distributed power" PV installation. • 2001 • Home Depot begins selling residential solar power systems in three stores in San Diego, California. A year later it expands sales to 61 stores nationwide.
Efficiency of Solar Cells Efficiency Compared with Cost Per Unit Area of PV Devices (The diagonal lines show installed 2001 price of modules per peak-watt. The theoretical limit for Shockley-Queisser devices [present limit] is 32 Third generation devices [shown in red] may exceed this limit by using multiple absorbers, hot carrier effects, or photocurrent doubling via impact ionization. The latter two phenomena are associated with quantum size effects in semiconductors and are being studied in semiconductor nanocrystals). Wikipedia L. Kazmerski, Solar-Electric Power: A 2001 Device Overview, National Center for Photovoltaics, National Renewable Energy Laboratory, Golden, CO (2001). M. Green, Annual Report, Third Generation Photovoltaics, University of New South Wales, Sydney, Australia (2000).
Grid contacts on the top surface of a typical cell are designed to have many thin, conductive fingers spreading to every part of the cell's surface.
Emerging Areas THIN Film Solar Cells Organic Solar Cells Dye Sensitized Solar Cells Quantum Dot Solar Cells
Organic Solar Cells The active polymer layer is sandwiched between two conducting electrodes. One of the electrodes is transparent to let the light in or out depending on the application. An additional conducting polymer layer, called PEDOT, is sometimes used to flatten the transport contact and help inject / carry positive charges in or out of the device. http://www.cdtltd.co.uk/technology/41.asp
See a NOVA CLIP from “SAVED BY THE SUN” (PBS Series) http://www.pbs.org/wgbh/nova/programs/ht/wm/3406_06_220.html
Dye Sensitized Photochemical Solar Cells Development of SC nanocluster based cells with more than 10% power conversion efficiency. Photon-to-photocurrent efficiency up to 100% has been claimed! Source: http://dcwww.epfl.ch/icp/ICP-2/icp-2.html
Principle of Dye-sensitized Photochemical Solar Cell M. Grätzel, Nature 2001, 414, 338−344. B. O’Regan, M. Grätzel, Nature 1991, 353, 737−740
Energy Research at Notre Dame e • Mimicking photosynthesis with the organized assembly of molecules • Quantum dot solar cells • Carbon nanotube architecture based solar cells & fuel cells • Solar hydrogen production • -photocatalysis hn CdSe 200 nm C60 TiO2 n n n n h h h h e e e e e C60 C60 e e e e e e e e e e Ag Ag Ag h h h h h h h h h h h h h h h TiO TiO TiO 2 2 2 ethanol ethanol ethanol ethanol products products products products See: http://www.nd.edu/~pkamat/energyconversion.html
2.3 nm 3.0 nm 2.6 nm 3.7 nm E e CB hn O R O VB CdSe TiO2 R h e h h h e e e Quantum Dot Solar Cells
Why photovoltaics make sense 1. Clean energy source. 2. Government or utility incentives 3. In 33 states, you can sell surplus power back to the utility. 4. If you live where it's possible to combine reasons 2 and 3, you actually might save money on the deal. • Will photovoltaics work on your house? • The geographic location and its weather determine the amount of solar potential. More efficient at lower temperatures, PV panels' output is reduced by shorter days and lower sun angles; cloud cover reduces output by only 5% to 20%. • A roof in North America should have a southern exposure and a slope of about 45°. Slopes between 15° and 60° are acceptable • Any shade cast on the panels significantly reduces the entire system's output, uninterrupted exposure is best, especially between 10 a.m. and 3 p.m. • Don't forget the environmental benefits • Next to global warming, acid rain, smog and pollution-related illnesses, the monetary savings of installing PV could be seen as secondary. • Over the course of its life, a 2.4 kWh system such as the one mentioned above will decrease the burden on the environment by 70 tons of carbon dioxide, 810 lb. of sulfur oxide and 210 lb. of nitrogen oxide generated by conventional power plants.
Three types of coomercially available PV silicon cells Single crystalline cells are most efficient at solar conversion (12% to 15% conversion to electricity) and carry the longest warranty (usually 25 years) Multicrystalline cells are easier to manufacture, but less efficient (11% to 14%) due to a lower-grade silicon. Prices for both single- and multi-crystalline cells are around $5.50 per watt generated; generally, multicrystalline costs slightly less. Amorphous (noncrystalline) cells are made from a thin film deposited on various (even flexible) substrates. These cells have lower efficiency (5.5% to 7.5%) and shorter warranty. The thin-film technology does allow the cells to be used in building-integrated PV products, such as roof shingles made by Uni-Solar (www.unisolar.com). http://www.taunton.com/finehomebuilding/how-to/articles/plugging-into-sun.aspx
Solar electricity was always a good idea. Is it finally affordable? by Joe Provey http://www.taunton.com/finehomebuilding/how-to/articles/plugging-into-sun.aspx The cost of PV-generated power is between 20¢ and 40¢ per kwh over the life of the system. Factors such as net-metering, rebates and tax credits can reduce the overall cost by as much as half. • Doing the math • To size the system, divide daily power consumption by the average hours of full sun per day. Our sample house uses 30kwh per day, gets 4.5 hours of sun and would need a 6.67kw system (30kwh ÷ 4.5 hours = 6.67kw). • At a national average cost of $6,000 per kw, this system would cost about $40,000. • Over the course of 20 years (a conservative estimate of the life of a PV system), this house's system would generate 219,000kwh of power. At 8¢ per kwh, that's $17,520 worth of electricity. (Totals do not reflect future increases in utility costs or interest rates.) After factoring in the value of the electricity generated, this PV system's net cost is $22,480. With California's $4,000 per kw subsidy, this system in Fresno would put $12,617 in the owner's pocket. See Onlne calculator: www.eere.energy.gov/state_energy).
Chevron Energy Solutions Completes Large-Scale Solar Power Installation at Fresno State FRESNO, Calif., November 8, 2007 Chevron Energy Solutions, a unit of Chevron Corporation and Fresno State Univ., today announced the completion of a large-scale solar power installation at Fresno State that will supply 20 percent of the university's annual power needs. The 1.1-megawatt solar system—the largest photovoltaic (PV)-paneled parking installation at a U.S. university—is expected to save Fresno State more than $13 million in avoided utility costs over its 30-year lifespan. The 10 structures, which provide the only shaded parking on the campus, comprise 3,872 photovoltaic panels mounted on top of more than 700 carport stalls http://www.chevronenergy.com/news_room/default.asp?pr=pr_20071108.asp
A California Solar Subdivision Although solar power makes a tiny percent of California's total electricity, state incentives and consumer interest are changing the way homes are built. http://video.on.nytimes.com/?fr_story=035f2ddec94b224429535e185c74579d6c1aede8
PV Land Area Requirements 1.2x10⁵ TW of solar energy potential globally Generating 1x101 TW with 10% efficient solar farms requires 1x10²/1.2x105 = 0.08% of Globe = 4x10¹¹ m2 (i.e., 4.4 % U.S.A) 6 Boxes at 1.5 TW Each
PV Land Area Requirements 4TW 20 TW
Update: May 22, 2008 http://tonto.eia.doe.gov/state/ US Overview
Mass-produced widely distributed PV arrays and wind turbines making electrolytic H2 or electricity may eventually generate 10 to 30 TW emission-free. The global grid proposed by R. Buckminster Fuller with modern computerized load management and high-temperature superconducting (HTS) cables could transmit electricity from day to night locations Need for Revolutionary ideas to Create New Technologies Hoffert et al., Advanced Technology Paths to Global Climate Stability: Energy for a Greenhouse Planet.2002, 298, 981-987.
Green Power for Victoria The world’s longest undersea cable (290 km) is bringing energy generated from renewable sources on the island of Tasmania to the Australian continent. If necessary, the link, which was built by Siemens, will work in the opposite direction as well. Thyristors for the interconnector between Australia and Tasmania. The 290-kilometer link carries 600 megawatts of power. P i c t u r e s o f t h e F u t u r e | S p r i n g 2 0 0 6 http://www.usa.siemens.com/answers/en/us/environment.htm
….. We choose to go to the moon and do the other things, not because they are easy, but because they are hard, because that goal will serve to organize and measure the best of our energies and skills, because that challenge is one that we are willing to accept, one we are unwilling to postpone, and one which we intend to win, and the others, too. President John F. Kennedy, Rice University, Houston September 12, 1962 http://webcast.rice.edu/speeches/19620912kennedy.html (See Video 9:30)
We need a similar vision to tackle the challenge of meeting clean energy demand.
Q. If demand for energy increases at a rate of 3% per year, how long it will take to match the energy we receive from sun? I (Sun) = 1.2x10⁵ TW I0 (today) = 12 TW (or 0.01% Sun) Ans. I = I0 ekt or ln(I/I0) =kt or ln (105) = kt If k = 0.03 year-1 t = ln(105) /0.03 = 9.21/0.03 = 307 years!!!