Download
1 / 16
170 likes | 203 Views
Learn about the Aggregate Supply Curve, Short-Run vs. Long-Run Supply, Equilibrium Price Level, Monetary and Fiscal Policy Effects, and Causes of Inflation.

E N D
Aggregate Supplyand the EquilibriumPrice Level Prepared by: Fernando & Yvonn Quijano
The Aggregate Supply Curve aggregate supply The total supply of all goods and services in an economy. The Aggregate Supply Curve: A Warning aggregate supply (AS) curve A graph that shows the relationship between the aggregate quantity of output supplied by all firms in an economy and the overall price level. An “aggregate supply curve” in the traditional sense of the word supply does not exist. What does exist is what we might call a “price/output response” curve—a curve that traces out the price decisions and output decisions of all firms in the economy under a given set of circumstances.
The Aggregate Supply Curve Aggregate Supply in the Short Run FIGURE 28.1 The Short-Run Aggregate Supply Curve In the short run, the aggregate supply curve (the price/output response curve) has a positive slope. At low levels of aggregate output, the curve is fairly flat. As the economy approaches capacity, the curve becomes nearly vertical. At capacity, the curve is vertical.
The Aggregate Supply Curve Shifts of the Short-Run Aggregate Supply Curve cost shock, or supply shock A change in costs that shifts the short-run aggregate supply (AS) curve. FIGURE 28.2 Shifts of the Short-Run Aggregate Supply Curve
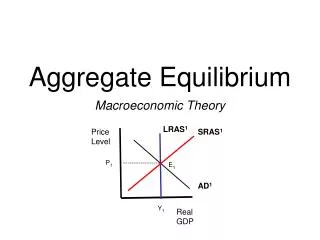
The Equilibrium Price Level equilibrium price level The price level at which the aggregate demand and aggregate supply curves intersect. FIGURE 28.3 The Equilibrium Price Level At each point along the AD curve, both the money market and the goods market are in equilibrium. Each point on the AS curve represents the price/ output decisions of all the firms in the economy. P0 and Y0 correspond to equilibrium in the goods market and the money market and to a set of price/output decisions on the part of all the firms in the economy.
The Long-Run Aggregate Supply Curve FIGURE 28.4 The Long-Run Aggregate Supply Curve When the AD curve shifts from AD0 to AD1, the equilibrium price level initially rises from P0 to P1 and output rises from Y0 to Y1. Wages respond in the longer run, shifting the AS curve from AS0 to AS1. If wages fully adjust, output will be back at Y0. Y0 is sometimes called potential GDP.
The Long-Run Aggregate Supply Curve Potential GDP potential output, or potential GDP The level of aggregate output that can be sustained in the long run without inflation. Short-Run Equilibrium Below Potential Output Although different economists have different opinions on how to determine whether an economy is operating at or above potential output, there is general agreement that there is a maximum level of output (below the vertical portion of the short-run aggregate supply curve) that can be sustained without inflation.
Monetary and Fiscal Policy Effects FIGURE 28.5 A Shift of the Aggregate Demand Curve When the Economy Is on the Nearly Flat Part of the AS Curve Aggregate demand can shift to the right for a number of reasons, including an increase in the money supply, a tax cut, or an increase in government spending. If the shift occurs when the economy is on the nearly flat portion of the AS curve, the result will be an increase in output with little increase in the price level from point A to point A’.
Monetary and Fiscal Policy Effects FIGURE 28.6 A Shift of the Aggregate Demand Curve When the Economy Is Operating at or Near Maximum Capacity If a shift of aggregate demand occurs while the economy is operating near full capacity, the result will be an increase in the price level with little increase in output from point B to point B’.
Monetary and Fiscal Policy Effects Long-Run Aggregate Supply and Policy Effects It is important to realize that if the AS curve is vertical in the long run, neither monetary policy nor fiscal policy has any effect on aggregate output in the long run. The conclusion that policy has no effect on aggregate output in the long run is perhaps startling.
Causes of Inflation Demand-Pull Inflation demand-pull inflation Inflation that is initiated by an increase in aggregate demand.
Causes of Inflation Cost-Push, or Supply-Side, Inflation cost-push, or supply-side, inflation Inflation caused by an increase in costs. FIGURE 28.7 Cost-Push, or Supply-Side, Inflation An increase in costs shifts the AS curve to the left. By assuming the government does not react to this shift, the AD curve does not shift, the price level rises, and output falls.
Causes of Inflation Cost-Push, or Supply-Side, Inflation stagflation Occurs when output is falling at the same time that prices are rising. FIGURE 28.8 Cost Shocks Are Bad News for Policy Makers A cost shock with no change in monetary or fiscal policy would shift the aggregate supply curve from AS0 to AS1, lower output from Y0 to Y1, and raise the price level from P0 to P1. Monetary or fiscal policy could be changed enough to have the AD curve shift from AD0 to AD1. This policy would raise aggregate output Y again, but it would raise the price level further, to P2.
Causes of Inflation Expectations and Inflation When firms are making their price/output decisions, their expectations of future prices may affect their current decisions. If a firm expects that its competitors will raise their prices, in anticipation, it may raise its own price. Given the importance of expectations in inflation, the central banks of many countries survey consumers about their expectations.
Causes of Inflation Money and Inflation FIGURE 28.9 Sustained Inflation From an Initial Increase in G and Fed Accommodation An increase in G with the money supply constant shifts the AD curve from AD0 to AD1. Although not shown in the figure, this leads to an increase in the interest rate and crowding out of planned investment. If the Fed tries to keep the interest rate unchanged by increasing the money supply, the AD curve will shift farther and farther to the right. The result is a sustained inflation, perhaps even hyperinflation.
Causes of Inflation Sustained Inflation as a Purely Monetary Phenomenon Virtually all economists agree that an increase in the price level can be caused by anything that causes the AD curve to shift to the right or the AS curve to shift to the left. It is also generally agreed that for a sustained inflation to occur, the Fed must accommodate it. In this sense, a sustained inflation can be thought of as a purely monetary phenomenon.