Download
1 / 78
780 likes | 854 Views
Learn about remote sensing, its applications in various fields, the principles of interaction between radiation and targets, image classification methods, and examples with detailed steps.

E N D
IMAGE CLASSIFICATION DATA INTEGRATION AND ANALYSIS • EVREN BAKILAN • ITU • UUBF • 110020228 • BAHAR(2006)
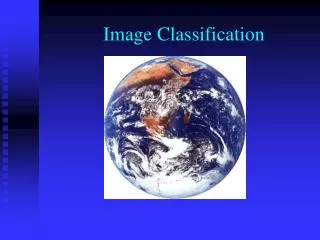
What is Remote Sensing? The science and art of obtaining information about an object,area, or phenomenon through the analysis of data acquired by a device that is not in contact with the object, area, or phenomenon under investigation.The practice of deriving information about the earth's land and water surfaces using images acquired from an overhead perspective, using electromagnetic radiation in one or more regions of the electromagnetic spectrum, reflected or emitted from the earth's surface.
Applications of Remote Sensing • Meteorology (Weather Prediction) • Climatology • Oceanography • Costal Studies • Water Resources • Geology • Archeology • Land cover\land use
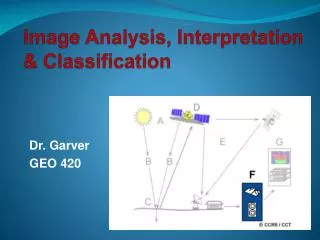
Principle of Remote Sensing Interaction between incident radiation and the targets of interest Energy Source or Illumination (A) Radiation and the Atmosphere (B) Interaction with the Target (C) Recording of Energy by the Sensor (D) Transmission, Reception, and Processing (E) Interpretation and Analysis (F) Application (G)
Band Combinations 3,2,1 4,3,2 5,4,3
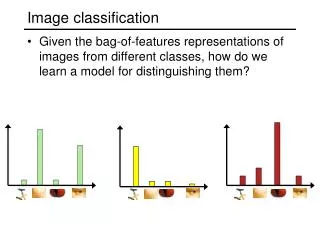
Band 4 Band 3 Feature space image • A graphical representation of the pixels by plotting 2 bands vs. each other • For a 6-band Landsat image, there are 15 feature space images
Each color represents a different “cluster” pixels that may correspond to the land cover classes you are interested in
Image Classification • Why classify? • Make sense of a landscape • Place landscape into categories (classes) • Forest, Agriculture, Water, etc • Classification scheme = structure of classes • Depends on needs of users
What is a Classified Image • Image has been processed to put each pixel into a category • Result is a vegetation map, land use map, or other map grouping related features • Categories are defined by the intended use of the map • Can be few or many categories, depending on the purpose of the map and available resources
Land Cover Classification Defining the pieces that make up the puzzle
Land cover classification steps • Define why you want a classified image, how will it be used? • Decide if you really need a classified image • Define the study area • Select or develop a classification scheme (legend) • Select imagery • Prepare imagery for classification • Collect ancillary data • Choose classification method and classify • Adjust classification and assess accuracy
Example Uses • Provide context • Landscape planning or assessment • Research projects • Drive models • Global carbon budgets • Meteorology • Biodiversity
Application in Agriculture A - color infrared photograph of big lake B - classified image of big lake C - QuickBird image of big lake D - classified satellite image
Basic Strategy: How do you do it? • Use radiometric properties of remote sensor • Different objects have different spectral signatures
Basic Strategy: How do you do it? • In an easy world, all “Vegetation” pixels would have exactly the same spectral signature • Then we could just say that any pixel in an image with that signature was vegetation • We’d do the same for soil, etc. and end up with a map of classes
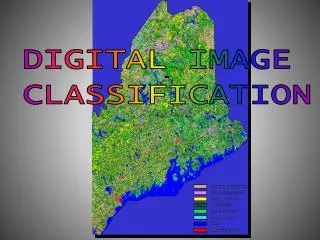
Image Classification Example: Near Mary’s Peak classification process Input dataOutput data (Digital) (Thematic)
Image Classification black = water yellow = open/field dark green = dense forest light green = sparse forest bronze = mixed urban red = dense urban
Query Formulation Query “patch” – pertaining to some semantics, e.g. mountains Satellite Image Database Ranked Results • Purpose ? • Geography - Find mountainous regions with snow-caps (low-level semantics). • Forestry – Find forests of a certain density, analyze deforestation (mid-level semantics). • Military – Find air-bases in certain regions of the world (high-level semantics).
Basic strategy: Dealing with variability • Classification: • Delineate boundaries of classes in n-dimensional space • Assign class names to pixels using those boundaries
Information Classes vs. Spectral Classes • Information classes are categorical, such as crop type, forest type, tree species, different geologic units or rock types, etc. • Spectral classes are groups of pixels that are uniform (or near-similar) with respect to their brightness values in the different spectral channels of the data.
Classification Strategies • Two basic strategies • Supervised classification • We impose our perceptions on the spectral data • Unsupervised classification • Spectral data imposes constraints on our interpretation
Image Classification Classification Unsupervised Classification (Clustering) Supervised Classification No extensive prior knowledge required Unknown, but distinct, spectral classes are generated Limited control over classes and identities No detailed information Distribution Free Statistical Techniques based on probability distribution models, which may be parametric or nonparametric Euclidean classifier K-nearest neighbour Minimum distance Decision Tree
Conifer Deciduous Water Digital Image Supervised Classification Supervised classification requires the analyst to select training areas where he/she knows what is on the ground and then digitize a polygon within that area… Mean Spectral Signatures The computer then creates... Known Conifer Area Known Water Area Known Deciduous Area
Conifer Deciduous Water Unknown Supervised Classification Information Mean Spectral Signatures Multispectral Image (Classified Image) Spectral Signature of Next Pixel to be Classified
Areas of Interest Simple line detection filters • Detection of geometric features • e.g. buildings, • high-pass filtering & tresholding • template matching • (temporal) Change Detection • subtraction, ratio, correlation (movement) • comparison of classified images 2 -1 -1 -1 -1 2 -1 2 -1 -1 2 -1 -1 2 -1 2 -1 -1 -1 2 -1 -1 -1 -1 -1 2 -1 2 2 2 -1 -1 2 -1 -1 -1
Areas of Interest • Image Segmentation • detection of homogenous surfaces • by means of tresholding or edge-detection • Region-growing algorithm High-pass? Std-filtering? NDI?
Areas of Interest 1) Line-detection filters 3) tresholding 2) Averaging filter 2 -1 -1 -1 -1 2 -1 2 -1 -1 2 -1 1/9 1/9 1/9 -1 2 -1 2 -1 -1 1/9 1/9 1/9 -1 2 -1 -1 -1 -1 1/9 1/9 1/9 -1 2 -1 2 2 2 -1 -1 2 -1 -1 -1
Supervised Classification “Training”
Supervised Classification “Segmentation”
Supervised Classification • Common Classifiers: • Parallelpiped • Minimum distance to mean • Maximum likelihood
Supervised Classification: Statistical Approaches • Minimum distance to mean • Find mean value of pixels of training sets in n-dimensional space • All pixels in image classified according to the class mean to which they are closest
Supervised Classification • Parallelepiped Approach • Pros: • Simple • Makes few assumptions about character of the classes
Supervised Classification: Minimum Distance • Minimum distance • Pros: • All regions of n-dimensional space are classified • Allows for diagonal boundaries (and hence no overlap of classes)
Maximum Likelihood Classifier Mean Signature 1 Candidate Pixel Relative Reflectance Mean Signature 2 It appears that the candidate pixel is closest to Signature 1. However, when we consider the variance around the signatures… Blue Green Red Near-IR Mid-IR
Maximum Likelihood Classifier Mean Signature 1 Candidate Pixel Relative Reflectance Mean Signature 2 The candidate pixel clearly belongs to the signature 2 group. Blue Green Red Near-IR Mid-IR
Supervised Classification • In addition to classified image, you can construct a “distance” image • For each pixel, calculate the distance between its position in n-dimensional space and the center of class in which it is placed • Regions poorly represented in the training dataset will likely be relatively far from class center points • May give an indication of how well your training set samples the landscape
Supervised Classification • Some advanced techniques • Neural networks • Use flexible, not-necessarily-linear functions to partition spectral space • Contextual classifiers • Incorporate spatial or temporal conditions • Linear regression • Instead of discrete classes, apply proportional values of classes to each pixel; ie. 30% forest + 70% grass
Decision Rulesin Spectral Feature Space Maximum Likelihood (Discriminant Analysis Parallelpiped Minimum Distance to Means