Image Classification Basics
Image Classification Basics. Prepared by:. George McLeod. With support from:. NSF DUE-0903270. in partnership with:. Geospatial Technician Education Through Virginia’s Community Colleges (GTEVCC). Image Analysis.


Image Classification Basics
E N D
Presentation Transcript
Image ClassificationBasics Prepared by: George McLeod With support from: NSF DUE-0903270 in partnership with: Geospatial Technician Education Through Virginia’s Community Colleges (GTEVCC)
Image Analysis • Satellite images capture light by sampling over predetermined wavelength ranges which are referred to as “bands” or “channels” • To extract additional information from digital images use image processing techniques such as: False Color Composites, Image Ratios, and Classification (Supervised and Unsupervised)
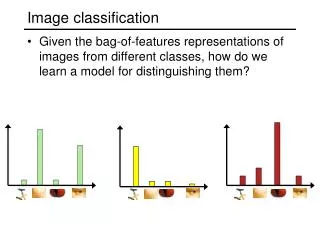
Two Kinds of Classification • Supervised • Unsupervised Image source: Dr. Ryan Jenson
Unsupervised Classification • Requires minimal amount of input from user • Based solely on numerical information in the data • Matched by the analyst to information classes • Pixels with similar digital numbers are grouped together into spectral classes using statistical procedures such as cluster analysis ISODATA • Iterative Self-Organizing Data Analysis Technique - Automated spectral clustering • User then identifies which class membership for each cluster
Supervised Classification • User selects area in image that represent each unique class (“Training” sites) • Pixel values for each band are recorded for class sample set • Computer matches rest of pixels to user defined classes based on closest distance in multi-dimensional image space • This outputs a classified image
Supervised Classification Image source: Dr. Ryan Jenson
Training Site Selection • Used in supervised classification • Homogeneous areas of land cover • Information derived from: • field studies, • thematic maps, • other areas of knowledge
Training Site Selection (Cont.) • Each site should have at least 10 times ‘n’ number of pixels, where n is equal to the number of bands used in the classification. • Map digitizing • On-screen digitizing
Supervised Classification Algorithms • Minimum Distance to the Means • Maximum Likelihood
Minimum Distance to Means The data points for DNs from two bands are dots; the mean for each clustered data set are the squares. For point 1, an unknown, the shortest straight-line distance to the several means is to the class "heather". Point 1, then, is assigned to this category. Point 2 is slightly closer to the "soil" category but lies within the edge of the "urban" spread. Here, the classification seems ambiguous. By the minimum distance rule, it would go to "soil" but this may be erroneous ("urban" would have been a greater likelihood). Point 3 is not near any of the class DN clusters, but is about equidistance between "urban", "water", "forest", and "heather". If one plays the odds, "urban" is just a tad closer to 3; but this situation indicates how misclassification might occur.
Maximum Likelihood Not shown is the fact that inside each ellipse are contours that indicate the degree of probability. Associated with each ellipse is a separate plot that expresses a statistical surface (bell-shaped in three dimensions) called probability density functions. Using these functions, which relate to the contours, a likelihood that any unknown point U is most probably associated with some one ellipse is determined. A Bayesian Classifier is a special case in which the likely occurrence of each class (common to rare) is assessed and integrated into the decision making.
Land Cover/Land Use Change Analysis • Growth or shrinkage of urban areas • Deforestation of tropic areas • Fire and burn damage • Damage done by hurricanes, • earthquakes, and tornados
Land Cover Classification PhragmitesAutralis - 1999 PhragmitesAutralis - 2002
Acquiring Satellite Data • http://glovis.usgs.gov/ USGS data viewer • http://edcsns17.cr.usgs.gov/NewEarthExplorer/ USGS New Earth Explorer • http://www.landcover.org/index.shtml Global Landcover facility at the University of Maryland • http://www.terraserver.com/view.asp Terraserver • http://www.ncdc.noaa.gov/nexradinv/index.jsp NOAA NexRad Radar Data