Download
1 / 57
570 likes | 577 Views
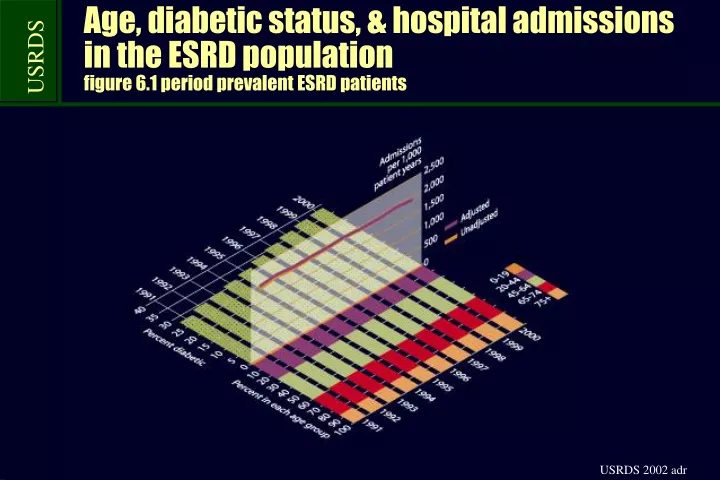
Age, diabetic status, & hospital admissions in the ESRD population figure 6.1 period prevalent ESRD patients. Age, diabetic status, & hospital admissions in the general Medicare population figure 6.2 period prevalent general Medicare patients.

E N D
Age, diabetic status, & hospital admissions in the ESRD populationfigure 6.1 period prevalent ESRD patients
Age, diabetic status, & hospital admissions in the general Medicare populationfigure 6.2 period prevalent general Medicare patients
Trends in days per admission, by modality & race/ethnicityfigure 6.3, period prevalent patients
Trends in days per patient year at risk, by modality & race/ethnicityfigure 6.4, period prevalent patients
Hospital admissions per patient year at risk, by gender, age, & modalityfigure 6.5, period prevalent patients, 1998-2000 combined
Hospital admissions per patient year at risk, by gender, race/ethnicity, & modalityfigure 6.6, period prevalent patients, 1998-2000 combined
Vascular access procedures,by age & gender: hemodialysisfigure 6.7, period prevalent hemodialysis patients, 2000
Infections, overall,by age & gender: hemodialysisfigure 6.7, period prevalent hemodialysis patients, 2000
Infections, vascular access,by age & gender: hemodialysisfigure 6.7, period prevalent hemodialysis patients, 2000
Cardiovascular procedures, overall,by age & gender: hemodialysisfigure 6.7, period prevalent hemodialysis patients, 2000
Heart catheterizations,by age & gender: hemodialysisfigure 6.7, period prevalent hemodialysis patients, 2000
Amputations,by age & gender: hemodialysisfigure 6.7, period prevalent hemodialysis patients, 2000
Catheter complications,by age & gender: peritoneal dialysisfigure 6.8, period prevalent peritoneal dialysis patients, 2000
Infections, overall,by age & gender: peritoneal dialysisfigure 6.8, period prevalent peritoneal dialysis patients, 2000
Infections, peritonitis,by age & gender: peritoneal dialysisfigure 6.8, period prevalent peritoneal dialysis patients, 2000
Cardiovascular procedures, overall,by age & gender: peritoneal dialysisfigure 6.8, period prevalent peritoneal dialysis patients, 2000
Heart catheterizations,by age & gender: peritoneal dialysisfigure 6.8, period prevalent peritoneal dialysis patients, 2000
Amputations,by age & gender: peritoneal dialysisfigure 6.8, period prevalent peritoneal dialysis patients, 2000
Hospital admissions, by primary diagnosis: dialysis patients age 65 & olderfigure 6.9, prevalent dialysis patients, 1999, unadjusted
Hospital admissions, by primary diagnosis: dialysis patients age 65 & olderfigure 6.9, prevalent dialysis patients, 1999, unadjusted (cont.)
Cardiovascular admissions, by diagnosis, age, & patient populationfigure 6.10, prevalent patients age 65 & older, 1999
Cardiovascular admissions, by diagnosis, age, & patient populationfigure 6.10, prevalent patients age 65 & older, 1999 (cont.)
Geographic variations in total hospital admissions: general Medicarefigure 6.11, prevalent patients age 65 & older, 1999, by HSA Admissions per 1,000 patient years at risk 442+ (482) 396 to <442 361 to <396 329 to <361 below 329 (302)
Geographic variations in total hospital admissions: dialysisfigure 6.11, prevalent patients age 65 & older, 1999, by HSA Admissions per 1,000 patient years at risk 2,385+ (2,721) 2,127 to <2,385 1,917 to <2,127 1,698 to 1,917 below 1,698 (1,509)
Hospital admissions, by diagnosis, patient population, & diabetic statusfigure 6.12, prevalent patients age 65 & older, 1999
Hospital admissions, by diagnosis, patient population, & genderfigure 6.13, prevalent patients age 65 & older, 1999
Hospital admissions, by diagnosis, patient population, & agefigure 6.14, prevalent patients, 1999
Hospital admissions, by diagnosis, patient population, & agefigure 6.14, prevalent patients, 1999 (cont.)
Hospital admissions, by diagnosis, patient population, & race/ethnicityfigure 6.15, prevalent patients age 65 & older, 1999
Hospitalization rates, by age, race/ethnicity, & genderfigure 6.16, incident dialysis patients, 1998-1999 combined, adjusted
Relative risk of first hospitalization (with 95% confidence interval)table 6.a, incident dialysis patients, 1998-1999 combined, adjusted
Hospitalization rates, by eGFR, race/ethnicity, & genderfigure 6.17, incident dialysis patients, 1998-1999 combined, adjusted
First-year first hospitalization rates, by BMI, race/ethnicity, & genderfigure 6.18, incident dialysis patients, 1998-1999 combined, adjusted
First-year first hospitalization rates, by age, race/ethnicity, & gender: diabeticsfigure 6.19, incident dialysis patients, 1998-1999 combined, adjusted
First-year first hospitalization rates, by age, race, & gender: non-diabeticsfigure 6.19, incident dialysis patients, 1998-1999 combined, adjusted
Relative risk of first hospitalization (with 95% confidence interval): by gendertable 6.b, incident hemodialysis patients, 1998-1999 combined
Relative risk of first hospitalization (with 95% confidence interval): by racetable 6.c, incident hemodialysis patients, 1998-1999 combined
Relative risk of first hospitalization (with 95% confidence interval): by diabetic statustable 6.d, incident hemodialysis patients, 1998-1999 combined
Hospitalization rates, by hemoglobin, gender, race, & diabetic statusfigure 6.20, incident hemodialysis patients, 1998-1999 combined, adjusted
Hospitalization rates, by URR, gender, race, & diabetic statusfigure 6.21, incident hemodialysis patients, 1998-1999 combined, adjusted
Hospitalization rates, by BMI, race/ethnicity, & URRfigure 6.22, incident hemodialysis patients, 1998-1999 combined, adjusted
Hospital admissions per patient year:IgA nephropathy/Berger’s, IgM nephropathyfigure 6.23, period prevalent ESRD patients, 1996-2000 combined, adjusted
Hospital days per patient year:IgA nephropathy/Berger’s, IgM nephropathyfigure 6.24, period prevalent ESRD patients, 1996-2000 combined, adjusted
Hospital admissions per patient year:Goodpasture’s syndromefigure 6.25, period prevalent ESRD patients, 1996-2000 combined, adjusted
Hospital days per patient year:Goodpasture’s syndrome figure 6.26, period prevalent ESRD patients, 1996-2000 combined, adjusted
Hospital admissions per patient year:lupus erythematosusfigure 6.27, period prevalent ESRD patients, 1996-2000 combined, adjusted
Hospital days per patient year:lupus erythematosus figure 6.28, period prevalent ESRD patients, 1996-2000 combined, adjusted
Hospital admissions per patient year:other secondary GN/vasculitisfigure 6.29, period prevalent ESRD patients, 1996-2000 combined, adjusted
Hospital days per patient year:other secondary GN/vasculitis figure 6.30, period prevalent ESRD patients, 1996-2000 combined, adjusted
Hospital admissions per patient year:sclerodermafigure 6.31, period prevalent ESRD patients, 1996-2000 combined, adjusted