Download
1 / 1
10 likes | 231 Views
Patel et al Supplemental Figure S2. TNFRSF10A hMSC1 β score: 0.10 CpG M: 0%. IGFBP7 HS-27a β score: 0.31 CpG M: 0%. PDGFB HS-27a β score: 0.41 CpG M: 0%. SNURF HS-27a β score: 0.44 CpG M: 38.1%. RUNX3 HS-27a β score: 0.51 CpG M: 30.8%. PDGFBR A673 β score: 0.88

E N D
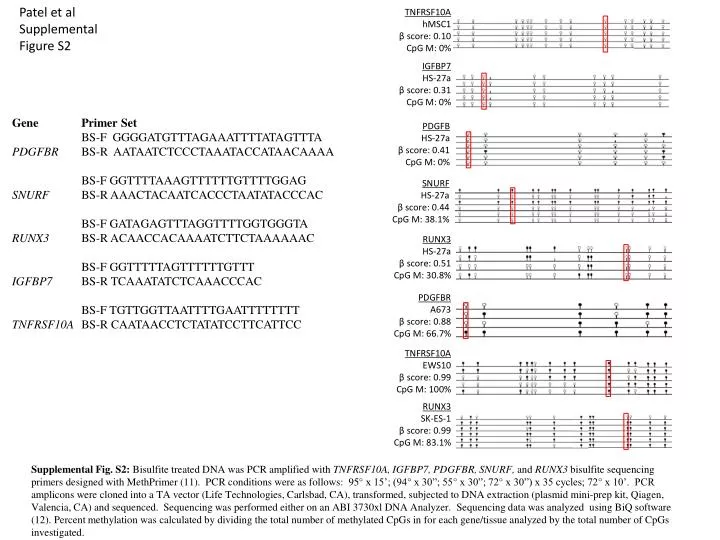
Patel et al Supplemental Figure S2 TNFRSF10A hMSC1β score: 0.10 CpG M: 0% IGFBP7 HS-27a β score: 0.31 CpG M: 0% PDGFB HS-27a β score: 0.41 CpG M: 0% SNURF HS-27a β score: 0.44 CpG M: 38.1% RUNX3 HS-27a β score: 0.51 CpG M: 30.8% PDGFBR A673 β score: 0.88 CpG M: 66.7% TNFRSF10A EWS10β score: 0.99 CpG M: 100% RUNX3 SK-ES-1 β score: 0.99 CpG M: 83.1% Supplemental Fig. S2: Bisulfite treated DNA was PCR amplified with TNFRSF10A, IGFBP7, PDGFBR, SNURF, and RUNX3bisulfite sequencing primers designed with MethPrimer (11). PCR conditions were as follows: 95° x 15’; (94° x 30”; 55° x 30”; 72° x 30”) x 35 cycles; 72° x 10’. PCR amplicons were cloned into a TA vector (Life Technologies, Carlsbad, CA), transformed, subjected to DNA extraction (plasmid mini-prep kit, Qiagen, Valencia, CA) and sequenced. Sequencing was performed either on an ABI 3730xl DNA Analyzer. Sequencing data was analyzed using BiQ software (12). Percent methylation was calculated by dividing the total number of methylated CpGs in for each gene/tissue analyzed by the total number of CpGs investigated.