Download
1 / 42
420 likes | 536 Views
Explore the various climate data resources provided by the NOAA Sectoral Applications Research Project for the Oklahoma Climatological Survey. Learn about volunteer observations, automated weather systems, and access real-time data on temperature, rainfall, humidity, and more.

E N D
Funding provided by NOAA Sectoral Applications Research Project Climate products Basic Climatology Oklahoma Climatological Survey
Cooperative Observer Data (COOP) • What is it? • Volunteers record temperature and precipitation observations once a day • Observations are either mailed on written forms or entered through the computer or a telephone system • Data are collected by the National Climatic Data Center (NCDC), where they are quality-assured • Typically takes 4-5 months before data are declared “official” • What is observed? • Daily Maximum and Minimum Temperatures • Precipitation (liquid) • Snowfall, Snow Depth • Where is it recorded? • ~8000 sites nationwide • ~200 active sites in Oklahoma • Dates back to before 1900
NWS – ASOS and AWOS • Automated Surface Observing System (ASOS) • 882 NWS/FAA stations in the United States • Generally dating back to ~1940s • Hourly weather observations • Automated Weather Observing System (AWOS) • Operated by the Federal Aviation Administration (FAA) • About 600 FAA stations in the United States • Older than ASOS • Usually do not report special observations (e.g., time of wind shifts) • The original observations relate to WEATHER, not CLIMATE. But if we look at this information over a much longer period of time, we can see climate trends.
Oklahoma Mesonet • County-level, real-time • 120 stations in Oklahoma • Commissioned in 1994 • Data reported every 5 minutes: • Temperature • Rainfall • Humidity • Winds • Sunshine (solar radiation) • Pressure • Soil temperature, soil moisture http://www.mesonet.org
CoCoRaHS • Community Collaborative Rain, Hail and Snow Network • Volunteer observers report rain, snow, and hail each day • Online “journal” allows tracking over time, comparing with neighbors • Established in Colorado in 1998 • Currently 11,000+ observers in all 50 states • Goal: a raingauge every mile • Need County Coordinators! http://www.cocorahs.org
Storm Reports • NOAA Storm Data publication (monthly – OFFIICIAL RECORDS): http://www7.ncdc.noaa.gov/IPS/sd/sd.html • NCDC Storm Events Database (usually 90-120 days behind the current month): http://www4.ncdc.noaa.gov/cgi-win/wwcgi.dll?wwEvent~Storms • Storm Prediction Center (unofficial reports usually up within a day or so): http://www.spc.noaa.gov/ (Reports tab) • Local Storm Reports (issued by National Weather Service offices as events are reported) • Contact your State Climate Office for assistance: http://www.stateclimate.org/
NOAA Climate Prediction Centerwww.cpc.noaa.gov 1 and 3 month outlooks Short-term outlooks U.S. Hazards Assessments U.S. Drought Assessment (also see www.drought.gov) ENSO (El Nino/La Nina)
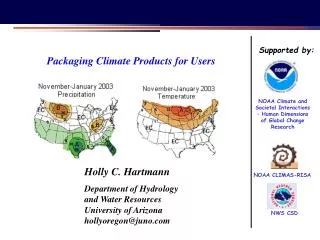
Seasonal Outlooks • From the Climate Prediction Center: http://www.cpc.noaa.gov/ • Three Month (seasonal) and One Month outlooks • Forecast is actually how confident they are about general tendencies (above, below, or near normal) • The darker the shading, the more confident the forecaster is that warmer/cooler/near normal/wetter/drier conditions will occur
Interpreting Seasonal Outlooks • A=Above, B=Below, N=Near Normal, EC=Equal Chances • EC indicates a 33.3% chance of conditions falling into one of the three categories (above, near normal, or below) • A (B) indicates that the forecaster thinks that conditions will be above (below) normal • Does not forecast how much above normal • Any contours show an increased confidence in the forecast trend
National Weather ServiceNorman: www.srh.noaa.gov/oun/ Tulsa: www.srh.noaa.gov/tsa/ Enhanced Page (current concerns) Data! Point-and-click Forecasts
NWS – Climate Section Summaries, studies, and resources produced by the local office
National Climatic Data Centerhttp://www.ncdc.noaa.gov/oa/climate/severeweather/extremes.html
Rainfall and Drought Update Choose from ten drought “seasons” Sorted by climate division Basic statistics Historical perspective & rankings “Specialized” indices Analog years (“most like current season”) Related fire danger and smoke management products
OCS Publications • Monthly Summaries • Oklahoma Climate (Seasonal Summaries) • Climate Event Summaries • Ice Storm • Tornado • Drought • County Climate Summaries • OCS/Mesonet Ticker
OCS/MesonetTicker • http://ticker.mesonet.org • Fun, interesting weather and climate information • A few of the recent really funny/interesting/informational tickers: • January 5, 2010 – deep freeze of December 1983 • January 12, 2010 – uncommon cold • January 25, 2010 – ice storm coming! • February 18, 2010 – once upon a midnight dreary • March 8, 2010 – this past winter explained • March 23, 2010 – spring break snow perspective • March 30, 2007 – winds, warm weather, and fire danger • April 14, 2010 – black Sunday revisited
![Climate Monitoring Products: BAMS experience Andrew Watkins [Australia]](https://cdn2.slideserve.com/4346849/slide1-dt.jpg)