Download
1 / 1
10 likes | 114 Views
Spatial and Temporal Dynamics of the Amazon Flood Wave Doug Alsdorf 1 , Paul Bates 2 , John Melack 3 , Matt Wilson 4 , and Tom Dunne 3

E N D
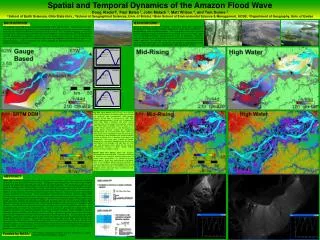
Spatial and Temporal Dynamics of the Amazon Flood Wave Doug Alsdorf1, Paul Bates 2, John Melack 3, Matt Wilson 4, and Tom Dunne 3 1 School of Earth Sciences, Ohio State Univ., 2 School of Geographical Sciences, Univ. of Bristol, 3 Bren School of Environmental Science & Management, UCSB, 4 Department of Geography, Univ. of Exeter BACKGROUND BACKGROUND Because water is a specular reflector, measuring dh/dt with repeat-pass interferometric SAR requires flooded vegetation (or some other mechanism of double-bounce such as telephone poles). The three photos at the right show the Amazon floodplain which is dominated by inundated forest which yields radar returns from both the water surface and the trunks of vegetation. However, wetlands throughout the world do not necessarily have an abundance of flooded woody vegetation. For example, Arctic wetlands (left photo) are marked by vast areas of open water lakes with no potential to provide a double-bounce radar travel path, thus the repeat-pass interferometric SAR method will not work. The interferometric SAR measurements provide dh/dt, not h and not dh/dx. Although water surface elevations and slope are key parameters in hydrodynamic modeling, we can gain some understanding of water flow by recognizing that continuity dictates dh/dt ≈ -dQ/dx. Thus the dh/dt mappings at mid-rising and high-water show changing water flows across the floodplain. These mappings are strikingly different from the conventional assumptions demonstrated in the gauge-based “mapping”. Because floodplains are not gauged, it is typically assumed that water levels on floodplains are equivalent to those in the adjacent channel. Such assumptions are clearly incorrect as demonstrated by comparing “Gauge-based” and “Mid-Rising” figures. SRTM DEM Top Row, Three Panels: Measurements and estimates of dh/dt. Spatial patterns of temporal water level changes are measured from interferometric SAR between February 26 and April 11 (44-day dt in 1993, “Mid-Rising”) and between April 15 and July 12 (88-day dt in 1996, “High Water”). Compare with dh/dt surface estimated from stream gauge measurements using the same 1993 dates at Itapeua (west of figure, 4.1°S, 63.0°W), Beruri (marked with +), and Manacapuru (*). Gauge based estimate created by extrapolating perpendicularly the in-channel dh/dt values, which are along-stream, linear interpolations from the three gauges (sharp change in dh/dt located exactly mid-way between Amazon and Purus rivers is therefore a construct of the extrapolation). Light green colors indicate non-flooded, upland forests, grey marks floodplain areas for which no interferograms are available, and light blue are main rivers and permanent lakes which do not yield an interferometric measure of dh/dt. Arrows indicate locations of sharp changes in dh/dt. Bottom Row, Two Panels: Water flow directions interpreted from measured dh/dt. Flow arrows are based on continuity with directions pointing toward areas of greater water accumulation, i.e., greater dh/dt from above figures. Black lines mark channels that deliver water to the floodplain during mid-rising conditions or serve as leaky barriers to broad floodplain flows during high water. Mid-rising flow is multi-directional across the floodplain whereas high water flow is uni-directional, sub-parallel to the Amazon River. ABSTRACT Water flow in rivers is typically measured at channel cross sections with simple geometry producing essentially a one-dimensional measurement. Floodplain and wetland flows are much more spatially complex with both large-scale diffusive and locally confined hydraulics. This complexity leads to a wide range of residence times and of carbon, nutrient, and sediment dynamics within the wetland ecosystem. However, our ability to model and hence predict the hydrologic, ecologic, and societal consequences of floods is greatly limited by the nearly complete lack of water height (h) measurements across floodplains virtually anywhere in the world. Using spaceborne interferometric synthetic aperture radar (SAR) measurements, we show the first ever spatially dense hydraulic mapping of the passage of a flood wave through a large, topographically complex floodplain. We find that temporal changes in flood water heights (dh/dt) are more complex than typically assumed and the water flows are not easily prescribed by flows down the main river and bathymetry alone. When lacking floodplain measurements of h, floodplain water surfaces are assumed to be horizontal extensions of those measured in the adjacent main river. Such assumptions do not match our measurements. Instead, during the passage of a flood wave, some floodplain channels are spatially coincident with sharp changes in dh/dt. Some floodplain channels separate adjacent locations with different rates of infilling. However, near the peak of the flood wave, some of these floodplain channels are no longer evident as controls on dh/dt. It is not clear from SRTM topography alone which channels serve as flow controls on dh/dt, rather dh/dt mapping of changing water levels reveals these patterns. During the passage of the flood wave, flow paths change from bathymetrically influenced to hydraulically controlled, thus it is difficult to a-priori know the flow path from bathymetry alone. The implications are that two-dimensional measurements of floodwater elevations and changes (dh/dt and slope, dh/dx) are needed to constrain two-dimensional models for predictions of floodwater movement in large floodplains. The Terrestrial Hydrology Program and the Solid Earth & Natural Hazards Program funded this research. Funded by NASA: