Optimizing Residence Time in Enhanced Biofilter Treatment for Urban Stormwater Management
This study evaluates the effectiveness of enhanced biofilter systems in treating urban stormwater by optimizing residence time in various media. Batch testing reveals that optimal contact times for metal removal range from 10 to 1,000 minutes, with specific media like peat showing varied results. The impact of different underdrain designs, including the innovative SmartDrain™, is analyzed for improving water balance and reducing clogging risks. Results demonstrate significant potential for improving stormwater treatment efficiency while mitigating pollutants effectively.

Optimizing Residence Time in Enhanced Biofilter Treatment for Urban Stormwater Management
E N D
Presentation Transcript
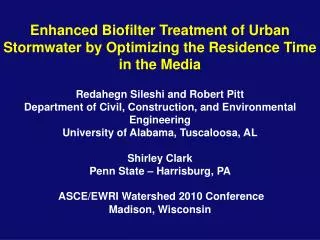
Enhanced Biofilter Treatment of Urban Stormwater by Optimizing the Residence Timein the Media Redahegn Sileshi and Robert Pitt Department of Civil, Construction, and Environmental EngineeringUniversity of Alabama, Tuscaloosa, ALShirley ClarkPenn State – Harrisburg, PA ASCE/EWRI Watershed 2010 ConferenceMadison, Wisconsin
Batch Testing Results: Contact Time Minimal filtered metal removal observed for all media except peat when contact time <10 minutes. The optimal contact times for filtered metals removal ranged from 10 to 1,000 minutes (17 hrs), depending on the metal and the media type. However too long of a contact time increased leaching losses from some media. Influent test water Rhyolite sand Surface modified zeolite Site zeolite Peat moss GAC
Underdrain Effects on Water Balance 0.75 inch rain with complex inflow hydrograph from 1 acre of pavement. 2.2% of paved area is biofilter surface, with natural loam soil (0.5 in/hr infilt. rate) and 2 ft. of modified fill soil for water treatment and to protect groundwater. No Underdrain Conventional (3” perforated pipe) Underdrain Restricted Underdrain
Outlet control can be more consistent in providing desired resident time for pollutant control. • However, most outlet controls (underdrains) are difficult to size to obtain long residence times. • Perforated pipe underdrains short-circuit natural infiltration, resulting in decreased performance (less runoff volume and peak flow rate reductions). • Orifice outlet controls that allow long residence times usually are very small and clog easily. • We are studying a foundation drain material (SmartDrainTM) that can be applied to biofiltration devices and provide another option for outlet control.
SmartDrainTM (http://www.smartdrain.com/) • SmartDrainTM operates under laminar flow conditions (Reynolds number of 100 to 600); low sediment carrying capacity and reduced clogging potential. • SmartDrainTM has132 micro channels in an 8 inch wide strip; results in very small discharge rates. Close-up photograph of SmartDrainTM material showing the microchannels on the underside of the 8 inch wide strip.
Variables affecting the drainage characteristics of the underdrain material A pilot-scale biofilter was used to test the variables affecting the drainage characteristics of the underdrain material: • Length • Slope • Hydraulic head • Type of sand media A fiberglass trough 10 ft long and 2 x 2ft in cross section used as the pilot-scale biofilter
Experimental procedure • The SmartDrainTM was installed on top of a 4” layer of the drainage sand, and another 4” layer of the sand was placed on top of the SmartDrainTM. • Flow rate measurements were manually taken from the effluent of the biofilter at 25 to 30 minute intervals until the water was completely drained from the trough. SmartDrainTM installation In the drainage sand (it was unrolled before placement of the cover sand).
Experimental procedure Cont. • During the tests, the trough was initially filled with water to a maximum head of 22 inches above the center of the pipe and then allowed to drain, resulting in head vs. discharge data. • A hydraulic jack and blocks were used to change the slope of the tank. test for effect of length and slope on the drainage characteristics of SmartDrainTM material
Experimental procedure Cont. • The flows were measured by timing how long it took to fill a 0.5 L graduated cylinder. • Five replicates for each of five different lengths of the SmartDrainTM (9.4ft, 7.1ft, 5.1ft, 3.1ft, and 1.1ft) and three to five slopes were examined to study the variables affecting the drainage characteristics of the material. Flow rate measurement from effluent of the biofilter
Slope tests on the SmartDrainTM material. Flow rate (L/s) = 0.13 (head, m) – 0.0049
Flow rate (L/s) = 0.12 (head, m) – 0.0036 • Slope of the SmartDrainTM material had no significant effect on the stage-discharge relationship, whereas only a small effect of length of the SmartDrainTM material on the discharge was observed (operates similar to a series of very small orifices).
Examining the clogging potential of the SmartDrainTM. • A Formica-lined plywood box was used to verify the head vs. discharge relationships for deeper water and used for the clogging tests. • The SmartDrainTM was installed on top of a 4” layer of the drainage sand, and another 4” layer of the sand was placed on top of the SmartDrainTM. • The box was filled with tap water to produce a maximum head of 4ft above the filter. • Sil-Co-Sil 250 was mixed with the test water to provide a concentration of 1g/L (1,000 mg/L). Formica-lined plywood box 3ft by 2.8ft. in cross sectional area and 4ft tall.
Particle size distributions of the sand filter media, and the US Silica Sil-Co-Sil 250 ground silica material used in the clogging tests. Sil-Co-Sil 250 test material (median size 45 µm) Filter Sand (median size 700 µm)
Turbidity measurements taken from the effluent of the device during the clogging tests. The initial turbidity values in the tank were about 1,000 NTU, similar to the initial turbidity values in the treated water. However, these effluent values decreased significantly and rapidly during the drainage period, with most of the sediment remaining trapped in the tank on top of the filter sand.
Plot showing Sil-Co-Sil 250 load(kg/m2) vs. equation slope coefficients for the clogging tests. Very little reduction in flow rates observed with time, even after 40 kg/m2 load on the biofilter (2 to 4 times the typical clogging load)
Biofilter Underdrain Options and Water Balance • The sandy-silt loam soil results in extended surface ponding, requiring an underdrain (736 hours of rain per year; 44,500 ft3/acre discharged to biofilters per year). • Conventional underdrain (3 inch perforated pipe) reduces ponding, but also decreases infiltration opportunities and decreases contact time with media. • SmartDrainTM also reduces ponding time, while providing additional infiltration and increased media contact time. Annual runoff (ft3/acre/year) and percentage fate:
Biofouling Testing of SmartDrainTM Material • The Formica-lined plywood box was also used to verify the head vs. discharge relationships for the biofouling tests. • The SmartDrainTM was installed on top of a 4” layer of the drainage sand, and another 4” layer of the sand was placed on top of the SmartDrainTM. • The box was filled with tap water and left open to the sun for several weeks to promote the growth of algae. Two different species of algal were added to the test water. • All-purpose liquid fertilizer was used to increase the growth of algae in the biofilter device. growth of algae in the biofilter device
Biofouling Tests of SmartDrainTM Material • Turbidity values in the tank after several weeks ranged from 6 to 39 NTU, whereas effluent values were reduced to 4 to 7 NTU during the drainage tests.
Stage-discharge relationships for the biofouling tests were very similar to the Sil-Co-Sil clogging test results. (combined results for 4 tests) y = 0.12x R2 = 0.97
Conclusions • The slope of the SmartDrainTM material had no significant effect on the stage-discharge relationship, while the length had only a small effect on the discharge rate. • Effluent turbidity (NTU) measurements decreased rapidly with time, indicating significant retention of silt in the test biofilter. • Clogging and biofouling of the SmartDrainTM material was minimal during extended tests. • Our tests indicate that the SmartDrainTM material provides an additional option for biofilters, having minimal clogging potential while also providing very low discharge rates which encourage infiltration and allow extended media contact periods, compared to typical underdrains.