Download
1 / 1
10 likes | 128 Views
Metabolic Concentrations and Ratios of Brain Tissue Amarjeet Bhullar, Lars Ewell, Tim McDaniel and Baldassarre Stea Department of Radiation Oncology, The University of Arizona 2008 AHSC Frontiers in Biomedical Research Poster Forum : October 15, 2008. Introduction

E N D
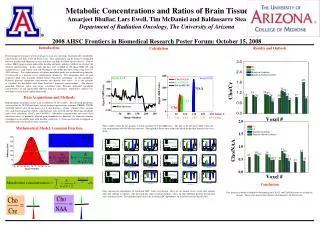
Metabolic Concentrations and Ratios of Brain Tissue Amarjeet Bhullar, Lars Ewell, Tim McDaniel and Baldassarre Stea Department of Radiation Oncology, The University of Arizona 2008 AHSC Frontiers in Biomedical Research Poster Forum: October 15, 2008 Introduction Proton magnetic resonance spectroscopy gives us in vivo spectrum, which provides metabolites concentration and their ratios on brain tissue. This information can be useful to distinguish between healthy and abnormal tissues and thus can help to follow-up the disease. Due to artifact, MRS signal contains undesirable baseline and noise, making it difficult to calculate the absolute concentrations. In this study, the data were recorded on GE Signa MRI (3T) and transferred to a work station (sun, GE Healthcare) for offline post-processing using Functool 2004 software. The signal intensity of various metabolite peaks was evaluated using integrals of each peak as a measure of its concentration (intensity). The integration limits of each respective peak were manually defined before Functool's calculation. In this calculation, Functool generates metabolite concentration and directly their ratios. It is also possible to calculate the metabolite ratio from Functool's generated concentrations. The directly generated Functool ratios and ratios calculated from Functool generated metabolite concentrations are not significantly different from our calculation. Quantitative analysis was also done by using linear combination model. Data Acquisitions and Methods Both phantom and patient exams were recorded on 3T GE scanner. The following parameters were used for all 2D CSI spectrums: a point resolved spectroscopy sequence (PRESS); TR/TE, 1000/144; field of view, 18 cm; matrix, 8 x 8; slice thickness, 10 mm. Choline (Cho), creatine (Cr), and N-acetylaspartate (NAA) concentrations were derived and the following metabolite ratios were calculated: Cho/Cr and Cho/NAA. Metabolite concentrations and ratios were calculated using (a) manually adjusted peak boundaries by Functool; (b) Gaussian function overlapped on metabolite peak with baseline correction; (c) Gaussian function overlapped on metabolite peak with baseline+noise correction. Mathematical Model: Gaussian Function Results and Outlook Calculation Plots of ADC values for two patients. Lesions extended over four MRI slices. The plot on the left shows ADC values for four examinations with low baseline intensity. The right plot shows three exams for which the baseline intensity was over 3000. Conclusion Our theoretical model is helpful to determining the Cho/Cr and Cho/NAA ratios to chasing the disease. These ratios may be best numeric discriminators for brain tissue. Plots showing the dependency of calculated ADC values on location. Plots are for normal tissue versus slice number measured superior to inferior. The left hand plot shows baseline intensity values for three different patients measured in areas of normal tissue. The right hand plot shows the resulting ADC dependency on slice location for normal tissue.