Download

1 / 24
240 likes | 379 Views
Urban Watershed Challenge. Storm Sewers & Watershed Models. Delineation Questions. Height-of-land delineation is altered by storm sewer Gravity and force main Do we need to correct for storm sewers? Significance of storm sewers is scale dependent Can we correct for storm sewers?.

E N D
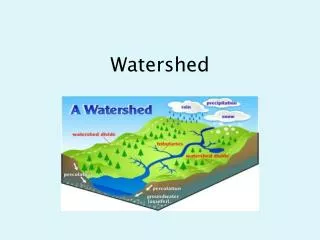
Urban Watershed Challenge Storm Sewers & Watershed Models
Delineation Questions • Height-of-land delineation is altered by storm sewer • Gravity and force main • Do we need to correct for storm sewers? • Significance of storm sewers is scale dependent • Can we correct for storm sewers?
Semi-Automated Delineation • Burn streams into DEM • Run initial delineation on modified DEM • Check with local sources and experts • Review DOQs • Modify streams and repeat the process
Manually delineated boundary Stream modified DEM boundary Boundary Disagreement
Storm Sewer Data • Acquire data • Mostly CAD format • Import to GIS • Georeference • no metadata • unknown coordinate systems
Challenge #1: Georeferencing Spatial adjustment tool used to fix georeferencing problem
Example: Effect of Lift Stations Manually delineated boundary Stream modified DEM boundary
City of Edina Storm Sewer Hennepin County Storm Sewer Challenge #2: Jurisdictional Issues Manually delineated boundary Stream modified DEM boundary
Limited use of directionality Challenge #3: Directionality
Interrupted by other feature types maintenace access holes Interrupted by missing surface water feature open ditch Challenge #4: Connectivity
Inconsistent attributes between sources Typically limited attributes Attributes may be as graphical annotation Challenge #5: Attributes
Summary of Challenges • Unknown coordinate systems • Overlapping jurisdictions • Lack of directionality • Lack of connectivity • Inconsistent and sparse attributes
Urban Watershed Models • Three basic algorithms for water quality modeling of urban watersheds • Event-mean concentration (EMC) • Regression model (rating curve) • Build-up / wash-off
EMC • Simplest approach - event mean concentration (EMC) • Many published values • Often monitoring is land use specific • EMCs area-weighted based on land use
EMC Land Use Specific EMCs (mg/L) Adapted from Harper, H. H. (1998).
EMC • Advantages • Allows evaluation of various land use scenarios • It’s simple (cheap) • Disadvantages • Too simple? • Ignores high variability (spatially and temporally) • No statistically significant difference between urban land uses (NURP) • Examples – Pondnet (Walker)
Regression Models • Another approach is to develop empirical relationships between runoff concentration and predictor variables • Flow • Land use • Soils • Climate
1000 1000 100 100 TSS (mg/L) Chloride (mg/L) 10 1 10 1 10 100 1000 1 10 100 1000 Flow (cfs) Flow (cfs) Regression Models
Regression Models • Advantages • Allows evaluation of various land use & soils • Still pretty simple • Disadvantages • Can account for spatial and temporal variability • Not mechanistic • Examples - Tasker & Driver (1988), SWMM, SWAT
Build-Up / Wash-Off • Build-up & wash-off • Mass balance of pollutants on impervious surfaces • A constant rate of accumulation • A first-order rate of non-runoff removal Non-runoff removal Accumulation
25 20 15 Mass (kg/m2) 10 5 0 0 10 20 30 40 50 Antecedent Dry Days 1 0.8 0.6 Fraction Mass Remaining 0.4 0.2 0 0 0.5 1 1.5 2 2.5 Daily Rainfall Intensity (in/hr) Build-Up / Wash-Off Build-Up Wash-Off
Build-Up / Wash-Off • Advantages • More mechanistic approach • Hopefully more broadly applicable • Disadvantages • More complicated • Lack the data needed to calibrate this model • Doesn’t address contributions from pervious areas • Examples – P8, SLAMM, SWMM, SWAT