Statistics in Science
240 likes | 321 Views
Learn the importance of using multiple test subjects in scientific studies to achieve more accurate and reliable results. Discover the benefits of averaging data, calculating means, normal distribution, standard deviation, and interpreting error bars.

Statistics in Science
E N D
Presentation Transcript
Use multiple samples • In science the more test subjects, the better! (You will get your most accurate results with huge test groups) • EX: I am testing the affects of Gatorade on the growth of tomato plants: • I DON’T have one plant I water with water and one plant I water with Gatorade • I DO have 50 plants I water with water and 50 plants I water with Gatorade (or even more!!)
Why so many samples? • The results on any one specimen could be an accident! • Ex: You never know if that one tomato plant would have grown larger than average….just because! (some people are tall, and some people are not) • If you have many test subjects, then average their results you get a more accurate representation of what will actually occur
Average (also known as mean) • To calculate the mean of a group of data simply add all the numbers together, and divide by how many numbers there are • Formula:
Fake tomato plant data(measured after 30 days) Calculate the mean for each column
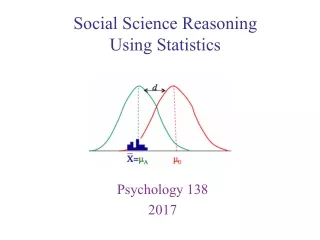
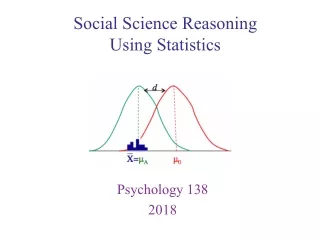
The normal distribution • Data about populations usually can be graphed into a pattern known as the “normal curve” • Ex: heights
The normal distribution has: • Symmetry about the centre point (which is the mean) • 50% of the values less than the mean, and 50% greater than the mean
Standard deviation • Standard Deviation • The Standard Deviation is a measure of how spread out numbers are. • Its symbol is σ (the greek letter sigma) • The formula is easy: it is the square root of the Variance. So now you ask, "What is the Variance?"
Variance • The Variance is defined as: • The average of the squared differences from the Mean. • To calculate the variance follow these steps: • Work out the Mean (the simple average of the numbers) • Then for each number: subtract the Mean and square the result (the squared difference). • Then work out the average of those squared differences.
Example: • You and your friends have just measured the heights of your dogs (in millimeters): • The heights (at the shoulders) are: 600mm, 470mm, 170mm, 430mm and 300mm. • Find out the Mean, the Variance, and the Standard Deviation. • Your first step is to find the Mean: 394 mm
To calculate the Variance, take each difference, square it, and then average the result: • So, the Variance is 21,704.
Standard deviation • Remember our example with the dogs? • The mean was 394 mm • The variance was 21704 • But we still needed to calculate the standard deviation!
The Standard Deviation is just the square root of Variance, so: • Standard Deviation: σ = √21,704 = 147.32... = 147 (to the nearest mm) • And the good thing about the Standard Deviation is that it is useful. Now we can show which heights are within one Standard Deviation (147mm) of the Mean:
So, using the Standard Deviation we have a "standard" way of knowing what is normal, and what is extra large or extra small. • Rottweilersare tall dogs. And Dachshunds are a bit short ... but don't tell them!
68% of values are within1 standard deviation of the mean • 95% are within 2 standard deviations • 99.7% are within 3 standard deviations
It is good to know the standard deviation, because we can say that any value is: • likely to be within 1 standard deviation (68 out of 100 will be) • very likely to be within 2 standard deviations (95 out of 100 will be) • almost certainly within 3 standard deviations (997 out of 1000 will be)
Error bars • Imagine you have made a bar graph to represent your data (such as the one below) How do you know if the difference between your results is enough?
To find out calculate the standard deviation for each of your data sets, and then put them on the graph. • Ex. My fake standard deviations are 2.3cm for Gatorade, and 1.2cm for Water. I put them on the graph as little lines at the tops of the bars
Notice the error bars overlap between my two sets of fake data… • This means that the difference between my results isn’t significant enough (in other words, they might as well not be different, so my experiment proves nothing!)