Introduction to Statistics and Science: Mean, Standard Deviation, and Normal Distribution
Explore the fundamentals of statistics and science, including the mean, standard deviation, and normal distribution. Learn how statistics are crucial in sports, politics, health, and weather analysis. Understand how errors are measured, and probabilities are calculated using the normal distribution.

Introduction to Statistics and Science: Mean, Standard Deviation, and Normal Distribution
E N D
Presentation Transcript
Statistics & Science Statistics and Science
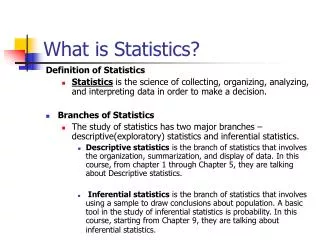
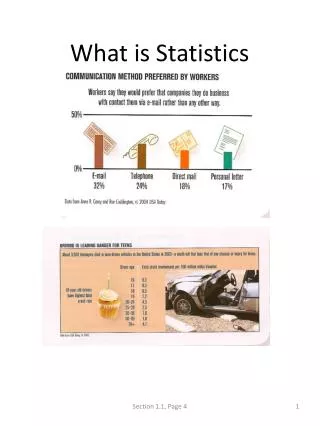
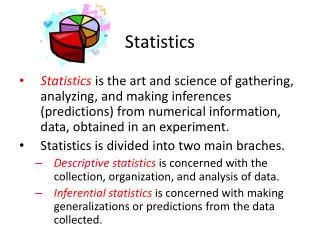
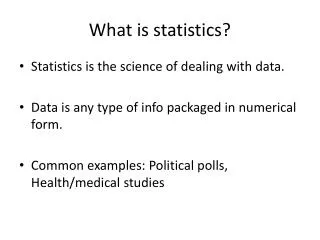
What are statistics? Statistics is a collection, classification, and analysis of numbers. Statistics is commonly used to describe: • Sports • Politics • Health • Weather Image from www.wvvotes.com Statistics and Science
The mean is an average. Found by: Summing and then dividing the sum by the amount of numbers. Example: Find the mean of: 5, 8, 2, 1 Add up the numbers: 5 + 8 + 2 + 1 = 16 Divide the sum by the number of scores: 4 The mean is 16 ÷ 4 = 4 Mean Statistics and Science
The standard deviation is a measure of the spread relative to the mean. Mean (µ) and Standard Deviation (σ) Statistics and Science
If all the data points are clustered around the mean, the standard deviation is low. If the data points are widelydispersed around the mean, the standard deviation is high. If all the data points have the same value, the standard deviation is zero. Statistics and Science
The Normal Distribution • Bell-shaped • Large data sets • Characterized by: • mean µ • standard deviation s Statistics and Science
Errors and the Normal Distribution Measurements have random errors. They often characterized by the normal distribution. Normal distribution Probability of a given error can be calculated. Statistics and Science
Normal Probability Distribution • 68% of the data within one standard deviation of the mean. • 95% of the data within two standard deviations of the mean. Statistics and Science
How are statistics related to science? • Science is about decision! • Statistics standards for decisions. Statistics and Science