Understanding Motion Graphs: Distance, Velocity, and Acceleration Relationships
510 likes | 640 Views
Explore the fundamental concepts of motion through the analysis of distance vs. time, velocity vs. time, and acceleration vs. time graphs. Learn how slopes correlate with velocity and acceleration, the significance of intercepts, and the types of motion represented by straight and curved lines. This overview highlights key principles including constant velocity, uniform acceleration, and the behavior of freely falling objects under gravity. Understand how to interpret these graphs to analyze motion effectively.

Understanding Motion Graphs: Distance, Velocity, and Acceleration Relationships
E N D
Presentation Transcript
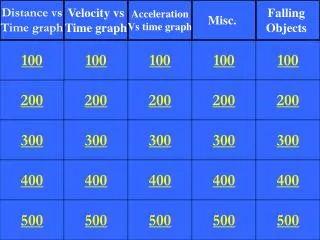
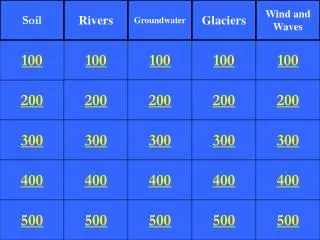
Distance vs Time graph Velocity vs Time graph Acceleration Vs time graph Misc. Falling Objects 100 100 100 100 100 200 200 200 200 200 300 300 300 300 300 400 400 400 400 400 500 500 500 500 500
Q: The “y” intercept is actually this kind of displacement.
Q: If an object has constant acceleration the graph will follow this shape.
Q: Negative slope shows an increase in velocity in this direction.
Q: Straight lines on the graph imply what kind of acceleration?
Q: A slope of zero will show an object with this kind of motion.
Q: Compared to speed, velocity is included with both of these terms.
Q: An objects average speed is equal to the distance traveled divided by what?
Q: This is one way of calculating instantaneous velocity at any point on a position vs. time graph.
Q: Acceleration is actually a measure of the rate of change of this.
Q: Average acceleration is the change in velocity divided by what?
Q: Freely falling objects undergo this kind of acceleration.
Q: A freely falling object will always have the same ___ acceleration.
Q: At the very top of an objects path upward the velocity is ___ but the acceleration is ___.
Q: All objects will fall at the same rate with the absence of this.


![[PDF]❤️DOWNLOAD⚡️ Hungry Girl: 200 Under 200: 200 Recipes Under 200 Calories](https://cdn7.slideserve.com/13155744/bestseller-dt.jpg)