Download
1 / 26
260 likes | 368 Views
VIVO International Researcher Network Katy Börner , CNS, IU, USA VIVO Workshop, KNAW, Amsterdam, The Netherlands January 18, 2013.

E N D
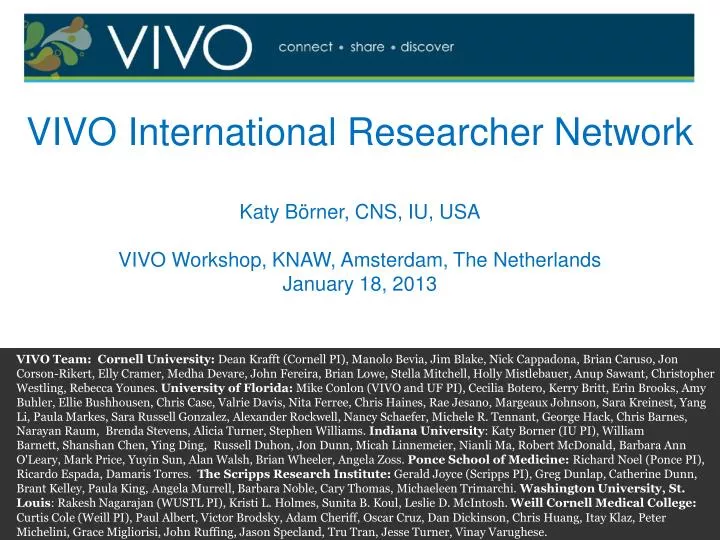
VIVO International Researcher Network Katy Börner, CNS, IU, USA VIVO Workshop, KNAW, Amsterdam, The Netherlands January 18, 2013 VIVO Team: Cornell University: Dean Krafft (Cornell PI), ManoloBevia, Jim Blake, Nick Cappadona, Brian Caruso, Jon Corson-Rikert, Elly Cramer, MedhaDevare, John Fereira, Brian Lowe, Stella Mitchell, Holly Mistlebauer, AnupSawant, Christopher Westling, Rebecca Younes. University of Florida: Mike Conlon (VIVO and UF PI), Cecilia Botero, Kerry Britt, Erin Brooks, Amy Buhler, Ellie Bushhousen, Chris Case, Valrie Davis, Nita Ferree, Chris Haines, Rae Jesano, Margeaux Johnson, Sara Kreinest, Yang Li, Paula Markes, Sara Russell Gonzalez, Alexander Rockwell, Nancy Schaefer, Michele R. Tennant, George Hack, Chris Barnes, Narayan Raum, Brenda Stevens, Alicia Turner, Stephen Williams. Indiana University: Katy Borner (IU PI), William Barnett,Shanshan Chen, Ying Ding, Russell Duhon, Jon Dunn, Micah Linnemeier, Nianli Ma, Robert McDonald, Barbara Ann O'Leary,Mark Price, Yuyin Sun, Alan Walsh, Brian Wheeler, Angela Zoss.Ponce School of Medicine: Richard Noel (Ponce PI), Ricardo Espada, Damaris Torres.The Scripps Research Institute: Gerald Joyce (Scripps PI), Greg Dunlap, Catherine Dunn, Brant Kelley, Paula King,Angela Murrell, Barbara Noble, Cary Thomas, MichaeleenTrimarchi.Washington University, St. Louis: RakeshNagarajan (WUSTL PI), Kristi L. Holmes, Sunita B. Koul, Leslie D. McIntosh.Weill Cornell Medical College: Curtis Cole (Weill PI), Paul Albert, Victor Brodsky, Adam Cheriff, Oscar Cruz, Dan Dickinson, Chris Huang, ItayKlaz, Peter Michelini, Grace Migliorisi, John Ruffing, Jason Specland, Tru Tran, Jesse Turner, VinayVarughese.
Type of Analysis vs. Level of Analysis 2
Temporal Analysis (When) Temporal visualizations of the number of papers/funding awarded at the institution, school, department, and people level 4
Topical Analysis (What) Science map overlays will show where a person, department, or university publishes most in the world of science. (in work) 5
Topical Analysis (What) Science map overlays will show where a person, department, or university publishes most in the world of science. (in work) 6
Network Analysis (With Whom?) Who is co-authoring, co-investigating, co-inventing with whom? What teams are most productive in what projects? 7 7
Overview, Interactivity, Details on Demand come to commonly used devices and environments VIVO On-The-Go 8
Using Data from VIVO • General Statistics • 36 publication(s) from 2001 to 2010 • (.CSV File) • 80 co-author(s) from 2001 to 2010 • (.CSV File) • Co-Author Network • (GraphML File) • Save as Image (.PNG file) • Tables • Publications per year (.CSV File) • Co-authors (.CSV File) • http://vivo.iu.edu/vis/author-network/person25557 9
v 36 publication(s) from 2001 to 2010 (.CSV File) 80 co-author(s) from 2001 to 2010 (.CSV File) Co-author network (GraphML File) Save as Image (.PNG file) Publications per year (.CSV File), see top file. Co-authors (.CSV File) 10
Run Sci2 Tool and Load Co-Author Network (GraphML File) Visualize the file using Radial Graph layout. Click on node to focus on it. Hover over a node to highlight its co-authors. Code and tutorials are linked from http://sci2.wiki.cns.edu Network Analysis Toolkit Nodes: 81 Edges: 390 12
http://nrn.cns.iu.edu Geospatial Analysis (Where?) Where are what NRN instances and what data holdings do they have? 14
2008 collaboration patterns for medical institutions located close to Melbourne University Source: Web of Science co authorship information. Compiled by Simon Porter 15
Co-authorship network for the department of Information Systems Source: Melbourne Research Windows. Contact Simon Porter simon.porter@unimelb.edu.au
Search term Researcher Bimodal network of search terms and researchers extracted from research profile search results to show the University’s capability in Disaster Management to the Government Contact: simon.porter@unimelb.edu.au 17
Top MeSH Disease Concepts Appearing in PubMed Publications by the University of Michigan Medical School. Links connect concepts where 100+ authors published about both concepts within the span of their careers. Contact: Jeffrey Horon, J.Horon@elsevier.com 18
Top MeSH Disease Concepts Appearing in PubMed Publications by the University of Michigan Medical School. Links connect concepts where 100+ authors published about both concepts within the span of their careers. This visualization revealed that animal disease models were central to disease research at U-M whiich encouraged additional thought and attention to animal husbandry, animal expenses, and core/shared services overall. Contact: Jeffrey Horon, J.Horon@elsevier.com 19
P30 Member Collaborations – Sponsored Project Co‐Participation and Co‐Authorship Network. Used in successful! P30 funding application. Shows the PI’s relationships with various P30 members, conveying that the PI was not only the formal center of the group but also the informal center and the person who exhibited the highest betweenness centrality. Contact: Jeffrey Horon, J.Horon@elsevier.com 20
Inter-Institutional Collaboration Explorer This visualization shows information about “collaborative publications” found at 2 or more Researcher Networking websites. The idea that institutions don't work together and that biomedical research is conducted in silos is not true. Researchers, even when separated by great distances, are in fact willing to work together, and this visualization demonstrates that they often do. Contact: Nick Benik (nbenik@gmail.com), Harvard Medical School, Boston, MA. URL: http://xcite.hackerceo.org/VIVOviz 21
Inter-Institutional Collaboration Explorer The outer solid colored arcs represent the 11 institutions. The size of the arc is proportional to the number of collaborative publications found on the site. The inner colored bands represent the number of collaborative publications found between the two institutions that each band connects. Clicking an institution's arc will hide any bands not connected to that institution and will display a timeline of when that institution's collaborative publications were written. 22
References Börner, Katy, Chen, Chaomei, and Boyack, Kevin. (2003). Visualizing Knowledge Domains. In Blaise Cronin (Ed.), ARIST, Medford, NJ: Information Today, Volume 37, Chapter 5, pp. 179-255. http://ivl.slis.indiana.edu/km/pub/2003-borner-arist.pdf Shiffrin, Richard M. and Börner, Katy (Eds.) (2004). Mapping Knowledge Domains. Proceedings of the National Academy of Sciences of the United States of America, 101(Suppl_1). http://www.pnas.org/content/vol101/suppl_1/ Börner, Katy, Sanyal, Soma and Vespignani, Alessandro (2007). Network Science. In Blaise Cronin (Ed.), ARIST, Information Today, Inc., Volume 41, Chapter 12, pp. 537-607. http://ivl.slis.indiana.edu/km/pub/2007-borner-arist.pdf Börner, Katy (2010) Atlas of Science. MIT Press. http://scimaps.org/atlas Scharnhorst, Andrea, Börner, Katy, van den Besselaar, Peter (2012) Models of Science Dynamics. Springer Verlag. 24
Register for free at http://ivmooc.cns.iu.edu. Class starts on Jan 22, 2013.
All papers, maps, tools, talks, press are linked from http://cns.iu.edu CNS Facebook: http://www.facebook.com/cnscenter Mapping Science Exhibit Facebook: http://www.facebook.com/mappingscience 26