Download
1 / 77
770 likes | 885 Views
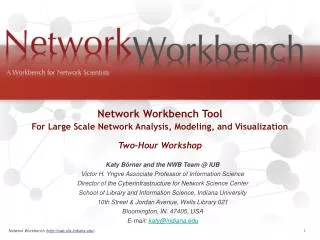
Network Workbench Tool For Large Scale Network Analysis, Modeling, and Visualization Two–Hour Workshop. Katy Börner and the NWB Team @ IUB Victor H. Yngve Associate Professor of Information Science Director of the Cyberinfrastructure for Network Science Center

E N D
Network Workbench Tool For Large Scale Network Analysis, Modeling, and Visualization Two–Hour Workshop Katy Börner and the NWB Team @ IUB Victor H. Yngve Associate Professor of Information Science Director of the Cyberinfrastructure for Network Science Center School of Library and Information Science, Indiana University 10th Street & Jordan Avenue, Wells Library 021 Bloomington, IN. 47405, USA E-mail: katy@indiana.edu Network Workbench (http://nwb.slis.indiana.edu). 1
Project Details Investigators: Katy Börner, Albert-Laszlo Barabasi, Santiago Schnell, Alessandro Vespignani & Stanley Wasserman, Eric Wernert Software Team: Lead: Micah Linnemeier Members: Patrick Phillips, Russell Duhon, Tim Kelley & Ann McCranie Previous Developers: Weixia (Bonnie) Huang, Bruce Herr, Heng Zhang, Duygu Balcan, Bryan Hook, Ben Markines, Santo Fortunato, Felix Terkhorn, Ramya Sabbineni, Vivek S. Thakre & Cesar Hidalgo Goal: Develop a large-scale network analysis, modeling and visualization toolkit for physics, biomedical, and social science research. Amount: $1,120,926, NSF IIS-0513650 award Duration: Sept. 2005 - Aug. 2009 Website: http://nwb.slis.indiana.edu Network Workbench (http://nwb.slis.indiana.edu). 2
Project Details (cont.) NWB Advisory Board: James Hendler (Semantic Web) http://www.cs.umd.edu/~hendler/ Jason Leigh (CI) http://www.evl.uic.edu/spiff/ Neo Martinez (Biology) http://online.sfsu.edu/~webhead/ Michael Macy, Cornell University (Sociology) http://www.soc.cornell.edu/faculty/macy.shtml Ulrik Brandes (Graph Theory) http://www.inf.uni-konstanz.de/~brandes/ Mark Gerstein, Yale University (Bioinformatics) http://bioinfo.mbb.yale.edu/ Stephen North (AT&T) http://public.research.att.com/viewPage.cfm?PageID=81 Tom Snijders, University of Groningen http://stat.gamma.rug.nl/snijders/ Noshir Contractor, Northwestern University http://www.spcomm.uiuc.edu/nosh/ Network Workbench (http://nwb.slis.indiana.edu). 3
Outline • Exemplary Network Science Research by NWB PIs • Computational Proteomics • Computational Economics • Computational Social Science • Computational Scientometrics • Computational Epidemics • NWB Tool Challenges and Opportunities • NWB Tool Overview • NWB Tool for Scientometrics Research • Discussion of Future Work Network Workbench (http://nwb.slis.indiana.edu). 4
Computational Proteomics What relationships exist between protein targets of all drugs and all disease-gene products in the human protein–protein interaction network? Yildriim, Muhammed A., Kwan-II Goh, Michael E. Cusick, Albert-László Barabási, and Marc Vidal. (2007). Drug-target Network. Nature Biotechnology 25 no. 10: 1119-1126. Network Workbench (http://nwb.slis.indiana.edu). 5
Computational Economics Does the type of product that a country exports matter for subsequent economic performance? C. A. Hidalgo, B. Klinger, A.-L. Barabási, R. Hausmann (2007) The Product Space Conditions the Development of Nations. Science 317, 482 (2007).
Computational Social Science Studying large scale social networks such as Wikipedia Vizzards 2007 Entry Second Sight: An Emergent Mosaic of Wikipedian Activity, The NewScientist, May 19, 2007
Computational Scientometrics 113 Years of Physical Review Bruce W. Herr II and Russell Duhon (Data Mining & Visualization), Elisha F. Hardy (Graphic Design), Shashikant Penumarthy (Data Preparation) and Katy Börner (Concept)
Computational Epidemics Forecasting (and preventing the effects of) the next pandemic. Epidemic Modeling in Complex realities, V. Colizza, A. Barrat, M. Barthelemy, A.Vespignani, Comptes Rendus Biologie, 330, 364-374 (2007). Reaction-diffusion processes and metapopulation models in heterogeneous networks, V.Colizza, R. Pastor-Satorras, A.Vespignani, Nature Physics 3, 276-282 (2007). Modeling the Worldwide Spread of Pandemic Influenza: Baseline Case and Containment Interventions, V. Colizza, A. Barrat, M. Barthelemy, A.-J. Valleron, A.Vespignani, PloS-Medicine 4, e13, 95-110 (2007). Network Workbench (http://nwb.slis.indiana.edu). 9
2. NWB Challenges and Opportunities • Data • Different data formats • Different data models • Algorithms • Different research purposes (preprocessing, modeling, analysis, visualization, clustering) • Different implementations of the same algorithm • Different programming languages • Algorithm developers/users are not computer scientists • Different tools (Pajek, UCINet, Guess, Cytoscape, R, …) • Different communities, practices, cultures Network Workbench (http://nwb.slis.indiana.edu). 10
NWB Deliverables Network Workbench (NWB) Tool • A network analysis, modeling, and visualization toolkit for physics, biomedical, and social science research. • Install and run on multiple Operating Systems. • Supports many file formats. • Easy integration of new algorithms thanks to CIShell/OSGi. Cyberinfrastructure Shell (CIShell) • An open source, software framework for the integration and utilization of datasets, algorithms, tools, and computing resources. • Extends OSGi industry standard. Network Workbench (http://nwb.slis.indiana.edu). 11
CIShell – Serving Non-CS Algorithm Developers & Users Users Developers IVC Interface CIShell Wizards CIShell NWB Interface Network Workbench (http://nwb.slis.indiana.edu). 12
CIShell – Builds on OSGi Industry Standard CIShell is built upon the Open Services Gateway Initiative (OSGi) Framework. OSGi (http://www.osgi.org) is • A standardized, component oriented, computing environment for networked services. • Successfully used in the industry from high-end servers to embedded mobile devices since 8 years. • Alliance members include IBM (Eclipse), Sun, Intel, Oracle, Motorola, NEC and many others. • Widely adopted in open source realm, especially since Eclipse 3.0 that uses OSGi R4 for its plugin model. Advantages of Using OSGi • Any CIShell algorithm is a service that can be used in any OSGi-framework based system. • Using OSGi, running CIShells/tools can connected via RPC/RMI supporting peer-to-peer sharing of data, algorithms, and computing power. Ideally, CIShell becomes a standard for creating OSGi Services for algorithms. Network Workbench (http://nwb.slis.indiana.edu). 13
NWB Deliverables Network Workbench (NWB) Tool • A network analysis, modeling, and visualization toolkit for physics, biomedical, and social science research. • Install and run on multiple Operating Systems. • Supports many file formats. • Easy integration of new algorithms thanks to CIShell/OSGi. Cyberinfrastructure Shell (CIShell) • An open source, software framework for the integration and utilization of datasets, algorithms, tools, and computing resources. • Extends OSGi industry standard. NWB Community Wiki • A place for users of the NWB Tool, the Cyberinfrastructure Shell (CIShell), or any other CIShell-based program to request, obtain, contribute, and share algorithms and datasets. • All algorithms and datasets that are available via the NWB Tool have been well documented in the Community Wiki. Network Workbench (http://nwb.slis.indiana.edu). 14
https://nwb.slis.indiana.edu/community/ Network Workbench (http://nwb.slis.indiana.edu). 15
https://nwb.slis.indiana.edu/community/ Network Workbench (http://nwb.slis.indiana.edu). 16
NWB Tool Release (Nov 2008) Major features in v1.0.0 beta 2 Release • Installs and runs on Windows, Linux and Mac OS X. • Provides over 80 modelling, analysis and visualization algorithms. Half of them are written in Fortran, others in Java. • Supports large scale network modelling and analysis for certain workflows (over 100,000 nodes) • Supports several visualization layouts with node/edge annotation. • Provides several sample datasets with various formats. • Supports multiple ways to introduce a network to the NWB tool. • Supports automatic data conversion. • Provides a Scheduler to monitor and control the progress of running algorithms. • Integrates a 2D plotting tool – Gnuplot (requires pre-installation on Linux and Mac). • Integrates GUESS graph exploration/visualization tool. Network Workbench (http://nwb.slis.indiana.edu). 17
Demo Network Workbench (http://nwb.slis.indiana.edu). 18
NWB Tool Overview • Download, install, and run. • Load, view, convert, save data. • Read and visualize a directory hierarchy. • Load a network, compute its basic properties, and explore it in GUESS. Network Workbench (http://nwb.slis.indiana.edu). 19
NWB Tool Overview • Download, install, and run. • Load, view, convert, save data. • Read and visualize a directory hierarchy. • Load a network, compute its basic properties, and explore it in GUESS. Network Workbench (http://nwb.slis.indiana.edu). 20
Download, install, and run Goto http://nwb.slis.indiana.edu NWB Tool 1.0.0 beta 2 (development release) November 19th, 2008 Select your operating system from the pull down menu. Save as *.jar file. Install and run. Session log files are stored in ‘*yournwbdirectory*/logs’ directory. Network Workbench (http://nwb.slis.indiana.edu). 21
NWB Tool Interface Components Network Workbench (http://nwb.slis.indiana.edu). 22
File, Preprocessing, Modeling, and Visualization Menus Network Workbench (http://nwb.slis.indiana.edu). 23
Analysis Menu and Submenus Network Workbench (http://nwb.slis.indiana.edu). 24
Integrated Tools Gnuplot portable command-line driven interactive data and function plotting utility http://www.gnuplot.info/. GUESS exploratory data analysis and visualization tool for graphs and networks. https://nwb.slis.indiana.edu/community/?n=VisualizeData.GUESS. Network Workbench (http://nwb.slis.indiana.edu). 25
Supported Data Formats In November 2008, the NWB tool supports loading the following input file formats: • GraphML (*.xml or *.graphml) • XGMML (*.xml) • Pajek .NET (*.net) & Pajek .Matrix (*.mat) • NWB (*.nwb) • TreeML (*.xml) • Edge list (*.edge) • CSV (*.csv) • ISI (*.isi) • Scopus (*.scopus) • NSF (*.nsf) • Bibtex (*.bib) • Endnote (*.enw) and the following network file output formats: • GraphML (*.xml or *.graphml) • Pajek .MAT (*.mat) • Pajek .NET (*.net) • NWB (*.nwb) • XGMML (*.xml) • CSV (*.csv) These formats are documented at https://nwb.slis.indiana.edu/community/?n=DataFormats.HomePage. Network Workbench (http://nwb.slis.indiana.edu). 26
NWB Ecology of Data Formats and Converters • Not shown are 15 sample datasets, 45 data preprocessing, analysis, modeling and visualization algorithms, 9 services. 13 6 Supported Output formats data for diverse visualization formats algorithms 8 Intermediate data formats Supported by 35 data converters.
Sample Datasets The ‘*yournwbdirectory*/sampledata’ directory provides sample datasets from the biology, network, scientometics, and social science research domains: /biology /network /scientometrics /scientometrics/bibtex /scientometrics/csv /scientometrics/endnote /scientometrics/isi • FourNetSciResearchers.isi /scientometrics/nsf • Cornell.nsf • Indiana.nsf • Michigan.nsf /scientometrics/scopus /socialscience • florentine.nwb The blue ones are used in this tutorial. Network Workbench (http://nwb.slis.indiana.edu). 30
Property Files and Python Scripts The ‘*yournwbdirectory*/” directory also contains /sampledata/scientometrics/properties // Used to extract networks and merge data • bibtexCoAuthorship.properties • endnoteCoAuthorship.properties • isiCoAuthorship.properties • isiCoCitation.properties • isiPaperCitation.properties • mergeBibtexAuthors.properties • mergeEndnoteAuthors.properties • mergeIsiAuthors.properties • mergeNsfPIs.properties • mergeScopusAuthors.properties • nsfCoPI.properties • scopusCoAuthorship.properties /sampledata/scripts/GUESS // Used to do color/size/shape code networks • co-author-nw.py • co-PI-nw.py • paper-citation-nw.py • reference-co-occurrence-nw.py Network Workbench (http://nwb.slis.indiana.edu). 31
NWB Tool Overview • Download, install, and run. • Load, view, convert, save data. • Read and visualize a directory hierarchy. • Load a network, compute its basic properties, and explore it in GUESS. Network Workbench (http://nwb.slis.indiana.edu). 32
Load, View and Save (Convert) Data Use 'File > Load File' to load florentine.nwb in sample datasets in ‘*yournwbdirectory*/sampledata/socialscience’. The loaded file will appear in the Data Manager window. Right click loaded file to save, view, rename, or discard. Network Workbench (http://nwb.slis.indiana.edu). 33
Data Converter Graph There is no central data format. Instead, data formats used in different communities and required by the different algorithms are supported. Network Workbench (http://nwb.slis.indiana.edu). 34
NWB Tool Overview • Download, install, and run. • Load, view, convert, save data. • Read and visualize a directory hierarchy. • Load a network, compute its basic properties, and explore it in GUESS. Network Workbench (http://nwb.slis.indiana.edu). 35
Reading and Visualizing a Directory Hierarchy Use ‘File > Read Directory Hierarchy’ with parameters Visualize resulting ‘Directory Tree - Prefuse (Beta) Graph’ using • ‘Visualization > Tree View (prefuse beta)’ • ‘Visualization > Tree Map (prefuse beta)’ • ‘Visualization > Balloon Graph (prefuse alpha)’ • ‘Visualization > Radial Tree/Graph (prefuse alpha)’ Network Workbench (http://nwb.slis.indiana.edu). 36
Different views of the /nwb directory hierarchy. Note the size of the /plugin directory. Network Workbench (http://nwb.slis.indiana.edu). 37
NWB Tool Overview • Download, install, and run. • Load, view, convert, save data. • Read and visualize a directory hierarchy. • Load a network, compute its basic properties, and explore it in GUESS. Network Workbench (http://nwb.slis.indiana.edu). 38
Compute Basic NW Properties & View in GUESS Select florentine.nwb in Data Manager. • Run ‘Analysis > Network Analysis Toolkit (NAT)’ to get basic properties. • Optional: Run ‘Analysis -> Unweighted & Undirected -> Node Betweenness Centrality’ with default parameters. • Select network and run ‘Visualization > GUESS’ to open GUESS with file loaded. • Apply ‘Layout -> GEM’. Network Workbench (http://nwb.slis.indiana.edu). 39
Pan: “grab” the background by holding left-click and moving your mouse. Zoom: Using scroll wheel, press the “+” and “-” buttons in the upper-left hand corner, or right-click and move the mouse left or right. Center graph by selecting ‘View -> Center’. Select to select/move single nodes. Hold down ‘Shift’ to select multiple. Right click to modify Color, etc. Network Workbench (http://nwb.slis.indiana.edu). 41
Graph Modifier: Select “all nodes” in the Object drop-down menu and click ‘Show Label’ button. Select “nodes based on ->”, then select “wealth” from the Property drop-down menu, “>=” from the Operator drop-down menu, and finally type “50” into the Value box. Then a color/size/ shape code. Network Workbench (http://nwb.slis.indiana.edu). 42
Interpreter: Uses Jython a combination of Java and Python. Try colorize(wealth, white, red) resizeLinear(sitebetweenness, 5, 25) Network Workbench (http://nwb.slis.indiana.edu). 43
NWB Tool for Scientometrics Research • Loading NSF datasets with currently active NSF funding for Indiana U, Cornell U, and Michigan U, extracting, and comparing Co-PI networks. • Loading ISI files of major network science researchers, extracting, analyzing and visualizing paper-citation networks and co-author networks. • Loading text files and detecting Bursts. Network Workbench (http://nwb.slis.indiana.edu). 44
NWB Tool for Scientometrics Research • Loading NSF datasets with currently active NSF funding for Indiana U, Cornell U, and Michigan U, extracting, and comparing Co-PI networks. • Loading ISI files of major network science researchers, extracting, analyzing and visualizing paper-citation networks and co-author networks. • Loading text files and detecting Bursts. Network Workbench (http://nwb.slis.indiana.edu). 45
Analyzing NSF Data Download NSF awards data from http://www.nsf.gov/awardsearch/ Network Workbench (http://nwb.slis.indiana.edu). 46
Analyzing NSF Data Active NSF Awards on 11/07/2008: • Indiana University 257 (there is also Indiana University at South Bend Indiana University Foundation, Indiana University Northwest, Indiana University-Purdue University at Fort Wayne, Indiana University-Purdue University at Indianapolis, Indiana University-Purdue University School of Medicine) • Cornell University 501 (there is also Cornell University – State, Joan and Sanford I. Weill Medical College of Cornell University) • University of Michigan Ann Arbor 619 (there is also University of Michigan Central Office, University of Michigan Dearborn, University of Michigan Flint, University of Michigan Medical School) Save files as csv but rename into .nsf. Or simply use the files saved in ‘*yournwbdirectory*/sampledata/scientometrics/nsf/’. Network Workbench (http://nwb.slis.indiana.edu). 47
Analyzing NSF Data Extracting Co-PI Networks Load NSF data, selecting the loaded dataset in the Data Manager window, run ‘Scientometrics > Extract Co-Occurrence Network’ using parameters: Two derived files will appear in the Data Manager window: the co-PI network and a merge table. In the network, nodes represent investigators and edges denote their co-PI relationships. The merge table can be used to further clean PI names. Running the ‘Analysis > Network Analysis Toolkit (NAT)’ reveals that the number of nodes and edges but also of isolate nodes that can be removed running ‘Preprocessing > Delete Isolates’. Select ‘Visualization > GUESS’ to visualize. Run ‘co-PI-nw.py’ script. Network Workbench (http://nwb.slis.indiana.edu). 48
Indiana U: 223 nodes, 312 edges, 52 components U of Michigan: 497 nodes, 672 edges, 117 c Network Workbench (http://nwb.slis.indiana.edu). 49 Cornell U: 375 nodes, 573 edges, 78 c
Select network after removing isolates and run ‘Analysis > Unweighted and Undirected > Weak Component Clustering’ with parameter Indiana’s largest component has 19 nodes, Cornell’s has 67 nodes, Michigan’s has 55 nodes. Visualize Cornell network in GUESS using same .py script and save via ‘File > Export Image’ as jpg. Network Workbench (http://nwb.slis.indiana.edu). 50