Download
1 / 46
460 likes | 541 Views
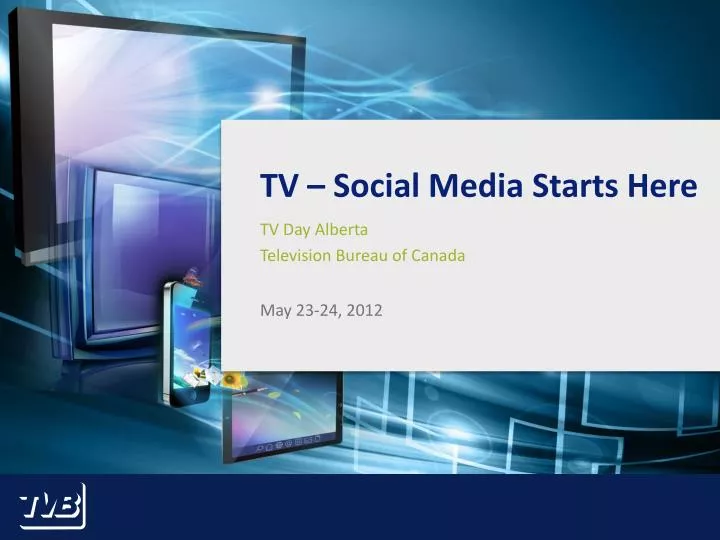
TV – Social Media Starts Here. TV Day Alberta Television Bureau of Canada. May 23-24, 2012. Is anybody watching?. Viewing & Investment Trends. Viewing Trends. 3.7 billion viewers 159.6 billion weekly hours viewed. Global Television Viewing.

E N D
TV – Social Media Starts Here TV Day Alberta Television Bureau of Canada • May 23-24, 2012
Is anybody watching? Viewing & Investment Trends
Viewing Trends 3.7 billion viewers 159.6 billion weekly hours viewed Global Television Viewing Source: Deloitte TMT 2011; World POPClock; Eurodata TV Worldwide
Viewing Trends Person 2+ – Millions of Weekly Hours • Source: BBM Canada InfoSys+ TV PPM; Total Weekly Hours; Total TV PPM; M-Su 2a-2a; YTD 11-12 = weeks 1-33; * includes Edmonton
Viewing Trends Person 2+ – Millions of Weekly Hours • Source: BBM Canada InfoSys+ TV PPM; Total Weekly Hours; Total TV PPM; M-Su 2a-2a; YTD 11-12 = weeks 1-33; * includes Edmonton
Viewing Trends Adults 18+ - Average Weekly Per Capita Hours • Source: BBM Canada InfoSys+ TV PPM; Total TV PPM; M-Su 2a-2a; YTD 11-12 = weeks 1-33; * includes Edmonton
Viewing Trends Adults 18+ - Average Weekly Per Capita Hours • Source: BBM Canada InfoSys+ TV PPM; Total TV PPM; M-Su 2a-2a; YTD 11-12 = weeks 1-33; * includes Edmonton
Viewing Trends Adults 18+ - Average Weekly Reach 98.1% 97.3% • Source: BBM Canada InfoSys+ TV PPM; Total TV PPM; M-Su 2a-2a; YTD 11-12 = weeks 1-33
Advertising Investment $227 billion 40.1% share of all ad revenue Global Television Investment Source: Deloitte TMT 2012; ZenithOptimedia Ad Spend Forecast
Advertising Investment TV revenue remains strong Top share of ad revenue Continued annual growth Net Advertising Volume
Advertising Investment Canadian Net Advertising Revenue 2010 - Share • Source: TVB Net Advertising Volume 2010
Advertising Investment Canadian Net Advertising Revenue 10-Year Trend – Millions • Source: TVB Net Advertising Volume 2010
Advertising Investment Net Advertising Revenue – Television Time Sales • Source: TVB Time Sales Survey (TSS)
More & More Commercials Commercial Clearance Statistics
Telecaster Services 60.9K commercial cleared for airing in 10/11 +10.0% vs. year ago :30’s dominate :15’s, :30’s & HD on the rise Commercial Clearance Source: TVB Telecaster Services
Telecaster Services Clearance Trends +11% +10% • Source: TVB Telecaster Services
Telecaster Services Share by Length – 2010/11 • Source: TVB Telecaster Services
Telecaster Services Share by Format – 2010/11 • Source: TVB Telecaster Services
Telecaster Services Clearance Trends • Source: TVB Telecaster Services
The Power of Technology TV Anywhere, Anytime
Multi Platform Four Screen World Source: Media Technology Monitor Fall 2011
Multi Platform Online Video – Weekly Access • Source: Media Technology Monitor Fall 2011
Multi Platform Online Video – Average Weekly Hours Per Capita • Source: Media Technology Monitor Fall 2011
PVR Adoption TV Household Penetration Rate % • Source: BBM Canada
PVR Trends TV Household Penetration Rate % • Source: BBM Canada
PVR Trends Adults 18+ - Live Viewing • Source: BBM Canada InfoSys+ TV PPM; Total TV PPM; M-Su 2a-2a; YTD 11-12 = weeks 1-33
PVR Trends PVR Owners - Live Viewing • Source: BBM Canada InfoSys+ TV PPM; Total TV PPM; M-Su 2a-2a; YTD 11-12 = weeks 1-33
PVR Trends Commercials can only be skipped during Playback - ~5% of viewing 46% of PVR Owners stop to watch commercials of interest 72% of PVR Owners are aware of the advertisers in the commercials viewed during fast forward Playback Statistics – Adults 18+ Source: TVB/BBM Analytics OmniVu Survey July 2011
Research Proving Television Advertising Effectiveness
Biometric Proof • Emotions are the primary driver of human behaviour and influence behaviour below conscious awareness • 95% of brain processing occurs below conscious awareness including the majority of emotional processing • Biometric marketing research measures the physiological responses traveling from the emotional centres of the brain to measure emotional engagement without bias Using Neuroscience to measure advertising effectiveness Conscious Associative NonConscious Source: Innerscope Research
Biometric Proof • Two ground breaking studies measured emotional engagement with advertising, and the priming effect or uplift provided to engagement with online advertising when combined with offline advertising Using Neuroscience to measure advertising effectiveness Source: Innerscope Research
Biometric Proof • Video advertising was proven to be most effective in creating emotional engagement with ads • Television was the most effective while static online display ads were shown to have little effect • The immersive nature of television enhances the emotional experience increasing engagement with the content and advertising Emotional Engagement Source: Innerscope Research
Biometric Proof • Exposure to an ad for a brand offline can provide a significant uplift to engagement with advertising for the same brand when subsequently exposed online • Television advertising had the greatest priming effect, lifting online engagement by 14 percentile points for video ads and 18 points for display ads Priming Effect Source: Innerscope Research
Advertising Perceptions • Relating to the advertising to which they are exposed, consumers report that television advertising is the most: • Influential • Persuasive & • Powerful The survey says… Source: BBM Analytics March 2012 – TVB Attitudinal Survey 2012
Advertising Perceptions Which ONE of the following media carries advertising that you believe to be the most influential? • Source: BBM Analytics March 2012 – TVB Attitudinal Survey 2012
Advertising Perceptions Which ONE of the following media carries advertising that you believe to be the most persuasive? • Source: BBM Analytics March 2012 – TVB Attitudinal Survey 2012
Advertising Perceptions Which ONE of the following media carries advertising that you believe to be the most powerful? • Source: BBM Analytics March 2012 – TVB Attitudinal Survey 2012
The Media Eco-System • While many rattled digital as the death knell of television, in reality linear TV and Online have become integral companions and have combined to amplify advertising communications • Rather than replacing linear, linear and digital have combined to create an experiential eco-system which is turning out to be greater than the sum of its parts Eco-system theory = whole > sum of parts Source: David Brennan – Media Native
The Media Eco-System • The power of emotion and implicit memory are essential to effective communication • Televisions immersive experience is key to creating a relaxed, receptive and shared environment in which messages reach the non conscious levels of our brain • Television creates an engaging experience built on story telling, trust and sharing Eco-system theory = whole > sum of parts Source: David Brennan – Media Native
The Media Eco-System • TV has been shown to lead and influence many forms of online behaviour, often occurring within seconds of the TV broadcast because of the emergence of “second screening” • Online has combined with television to create many new opportunities for advertisers Eco-system theory = whole > sum of parts Source: David Brennan – Media Native
The Media Eco-System • Online has allowed TV to add Point-of-Sale to its many strengths by creating a direct response channel • Online has become an audience builder for TV by allowing for new channels of content distribution • And online has allowed communities to rise around television content and advertiser communication seen on TV Eco-system theory = whole > sum of parts Source: David Brennan – Media Native
Social Networking The water cooler has moved online
Social Networking • 55% of Albertans have participated in Social Networking in the past month • 47% engage with TV online • 12% have chatted about a TV program • 4% chat about a program while watching Making Connections Source: Media Technology Monitor Fall 2011
Social TV • The top three Super Bowl ads created an amplifier effect generating 329K social media comments which multiplied into more than 200 million earned impressions on top of the paid media spots • People who chat about TV are 8x more likely to chat about brands The sum is greater than the parts Source: Bluefin Labs
Social TV • TV + Social Expression = countless earned impressions to followers who share an affinity with the speaker • Buzz drives Tune-in & Tune-in drives buzz • TV and Video content is moving to integration allowing advertisers to harness its power across all touch points and coordinate them to create a community around their message Amplifying Communication
Thank you. Theresa Treutler President & CEO Television Bureau of Canada ttreutler@tvb.ca www.tvb.ca Contact: