Visualization of Macromolecular Structures
Learn about the power of visualization in understanding macromolecular structures, mechanisms, and change, aiding in decision-making. Explore different methods and tools for visual storytelling. Illustrations and examples provided by experts in the field. Discover how to interpret biological assemblies and handle missing pieces in structural data.

Visualization of Macromolecular Structures
E N D
Presentation Transcript
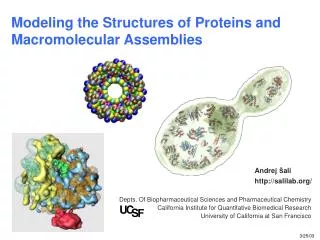
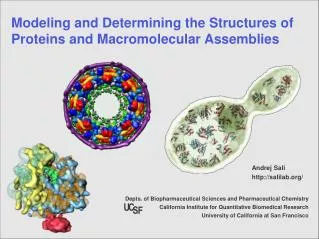
Visualization of Macromolecular Structures Shuchismita Dutta
Molecules Around You Julian Voss-Andreae David Goodsell
Why Visualize? • Communication: since human eye effective in pattern recognition • Summarize information • what, where, how many (data)? • mechanisms • change (cause and effect) • Decision making aid
Road sign near Niagara Falls. Picture postedby Tim Roy http://dd.dynamicdiagrams.com/?p=541 Visual storytelling
What, Where, How Many? http://popvssoda.com:2998/
What, Where, How Many? Structure of Kir2.2. (A) Stereoview of a ribbon representation of the Kir2.2 tetramer from the side with the extracellular solution above. Four subunits of the channel are uniquely colored. Approximate boundaries of the lipid bilayer are shown as gray bars. (B) A close-up view of the pore-region of a single subunit (in ribbon representation) with the turret, pore helix and selectivity filter labeled. Side chains of residues E139, R149 and a pair of disulfide-bonded cysteines (C123 and C155) are shown as sticks and colored according to atom type: carbon, yellow; nitrogen, blue; oxygen, red; and sulfur, green. Ionized hydrogen bonds are indicated by dashed black lines. The region flanked by the two disulfide-bonded cysteines is colored orange. (C) Electron density (blue wire mesh, 2Fo-Fc, calculated from 50 to 3.1Å using phases from the final model and contoured at 1.0 σ) is shown for the side chains of E139 and R149 [sticks, colored the same scheme as in (B)] forming a salt bridge. (D and E) K+ selectivity filter of the Kir2.2 channel (D) compared with that of the Kv1.2-Kv2.1 paddle chimera channel [(E), PDB ID 2R9R]. For clarity, only two of the four subunits [sticks, colored with the same scheme as in (B)] are shown. K+ (green spheres), water molecules (cyan spheres), and hydrogen bonds between R149 and E139 (Kir, dashed black lines), or between D379, M380 and waters (Kv, dashed black lines) are shown. Tao X, Avalos JL, Chen J, MacKinnon R., Science. 2009 Dec 18;326(5960):1668-74.
Change and Mechanism Figure 1 Crystal structure of SNARE-induced Ca2+-bound Syt3. (a) Showing a ribbon diagram of the C2AB fragment of Syt3 including the C2A (magenta) and C2B (yellow) domains, and bound Ca2+ ions (gray spheres). (b) Side view illustrating that the Ca2+-binding loops of both C2 domains emerge from the same side of the molecule. Residues Lys427, Lys557, and Arg556 are shown as sticks. (c) Superposition of the crystal structures of SNARE-induced Ca2−-bound (magenta and yellow) and Ca2+-free (blue, PDB ID 1DQV20) Syt3 C2AB fragments. We aligned structures by superposition of the Cα positions of their respective C2A domains (see cartoon where the “+” sign indicates the Ca2+-binding regions). Vrljic M, Strop P, Ernst JA, Sutton RB, Chu S, Brunger AT. Nat Struct Mol Biol. 2010, 17(3): 325–331.
Decision Making Aid Treating Chronic Myeloid Leukemia Gleevec bound to Abl Kinase PDB ID 1iep Sprycel bound to Abl Kinase PDB ID 2gqg Overlap of Gleevec & Sprycel bound to Abl kinase (PDB IDs 1iep, 2gqg) Mira Patel Student 2008, 2009
Visualization http://www.umass.edu/microbio/rasmol/history.htm
Early Drawings of Molecules Irving Geis Richard Dickerson Roger Hayward Linus Pauling
Wire models (1958) Richard’s box (1958) Ball and Spoke (1960) Byron’s bender (1970s) Rapid prototyping (1990s) Toobers (2000s) Physical Models Byron’s bender Rapid prototyping Laser crystal Toobers www.umass.edu/microbio/rasmol/history.htm
Early computers (1960s-70s) TAMS (1980s) Evans & Sutherland (1980s-90s) Modern computers (1990s …) Kinemage, Rasmol, Chimera … Computer Models Wireframe Ribbons Ball and Stick Space fill Surface
Visualizing Molecules • Visual Metaphors • assumptions and conventions • Dealing with Coordinates • Biological assembly • Missing atoms/residues • Split entries • Aesthetic Choices • Use of orientation, color and style • Scale: Atoms to Cells
Backbone All atoms Visualization Metaphors What does a molecule look like? Wireframe Ribbons Spacefill
Style and Purpose • Overall shape & structure – space fill • Fold, classification etc. - ribbons • Biologically significant regions - ball & stick, stick • Understand binding geometry • Design activators, inhibitors, drugs • Because molecules are complex and beautiful – mixed or other creative representations Illustrations from D. Goodsell
Dealing with Coordinates: Missing Pieces ATP Synthase: PDB entries 1c17, 1e79, 2a7u, 1l2p Illustrations from D. Goodsell
Program Defaults Waters?
Aesthetic Choices PDB ID 1tim chain B • Orientation • Color • Style
Scale: Atoms to Molecules to Cells Illustrations from D. Goodsell Illustrations that span scales from nanometers to microns, for use in education and science outreach.
1. Coordinate file from PDB 4. Molecule image 3. Computer 2. Visualization software RasMol, Chimera, Swiss PDB Viewer etc. Visualize molecules on a computer
PDB Format File: a Database Report • The database is built on PDB exchange & chemical component dictionaries which helps with keeping track of all the information • Validation uses dictionaries to • Check inter-relationships between different data components (PDB exchange dictionary) • Match information to chemical component dictionary
Meta data Coordinates Exploring PDB file
Title section OBSLTE 18-JUL-84 1HHB 2HHB 3HHB 4HHB SPLIT 1JGP 1JGQ 1JGO CAVEAT 1B86 THERE ARE CHIRALITY ERRORS IN C-ALPHA CENTERS REVDAT 4 24-FEB-09 4HHB 1 VERSN REVDAT 3 01-APR-03 4HHB 1 JRNL REVDAT 2 15-OCT-89 4HHB 3 MTRIX REVDAT 1 17-JUL-84 4HHB 0 SPRSDE 17-JUL-84 4HHB 1HHB
Remarks: the numbers mean something Biological assembly information
Remarks Compound details Missing residues, atoms Geometry: close contacts, bond length, angle and torsion deviations, sterochemistry Ligand details Related entries Sequence details
Chemistry sections : Primary Structure & Ligand DBREF 1BH0 A 1 29 UNP P01275 GLUC_HUMAN 53 81 SEQADV 1BH0 LYS A 17 UNP P01275 ARG 69 ENGINEERED SEQADV 1BH0 LYS A 18 UNP P01275 ARG 70 ENGINEERED SEQADV 1BH0 GLU A 21 UNP P01275 ASP 73 ENGINEERED SEQRES 1 A 29 HIS SER GLN GLY THR PHE THR SER ASP TYR SER LYS TYR SEQRES 2 A 29 LEU ASP SER LYS LYS ALA GLN GLU PHE VAL GLN TRP LEU SEQRES 3 A 29 MET ASN THR MODRES 2F4K NLE A 65 LEU NORLEUCINE MODRES 2F4K NLE A 70 LEU NORLEUCINE HET PO4 D 147 1 HET PO4 B 147 1 HET HEM A 142 43 HET HEM B 148 43 HET HEM C 142 43 HET HEM D 148 43 HETNAM PO4 PHOSPHATE ION HETNAM HEM PROTOPORPHYRIN IX CONTAINING FE HETSYN HEM HEME FORMUL 5 PO4 2(O4 P 3-) FORMUL 7 HEM 4(C34 H32 FE N4 O4) FORMUL 11 HOH *221(H2 O)
Secondary Structure & Connectivity HELIX 1 AA SER A 3 GLY A 18 1 16 HELIX 2 AB HIS A 20 SER A 35 1 16 HELIX 3 AC PHE A 36 TYR A 42 1 7 SHEET 1 A 4 ILE A 18 LEU A 23 0 SHEET 2 A 4 LEU A 111 VAL A 118 -1 O GLY A 115 N TRP A 19 SSBOND 1 CYS A 6 CYS A 127 1555 1555 2.02 SSBOND 2 CYS A 30 CYS A 115 1555 1555 2.02 SSBOND 3 CYS A 64 CYS A 80 1555 1555 2.03 SSBOND 4 CYS A 76 CYS A 94 1555 1555 2.01 LINK NE2 HIS A 87 FE HEM A 143 1555 1555 1.94 LINK NE2 HIS B 92 FE HEM B 147 1555 1555 2.07 LINK FE HEM B 147 O1 OXY B 150 1555 1555 1.87 LINK FE HEM A 143 O1 OXY A 150 1555 1555 1.66 CISPEP 1 PRO A 98 PRO A 99 0 0.53 CISPEP 2 GLY A 109 PRO A 110 0 -0.01
Crystallographic info, Coordinate Transformations & coordinates CRYST1 88.814 95.207 89.164 90.00 104.96 90.00 P 1 21 1 8 ORIGX1 1.000000 0.000000 0.000000 0.00000 ORIGX2 0.000000 1.000000 0.000000 0.00000 ORIGX3 0.000000 0.000000 1.000000 0.00000 SCALE1 0.011259 0.000000 0.003009 0.00000 SCALE2 0.000000 0.010503 0.000000 0.00000 SCALE3 0.000000 0.000000 0.011609 0.00000 MODEL 1 ATOM 1 N SER A 41 -9.122 -10.304 89.511 0.12 51.94 N ATOM 2 CA SER A 41 -8.282 -11.187 88.650 0.12 52.75 C ATOM 3 C SER A 41 -7.051 -11.693 89.414 0.12 52.51 C ATOM 4 O SER A 41 -6.646 -11.108 90.421 0.12 53.15 O ATOM 5 CB SER A 41 -7.845 -10.416 87.393 0.12 51.93 C ATOM 6 OG SER A 41 -7.250 -11.264 86.423 0.12 52.59 O ATOM 7 N THR A 42 -6.473 -12.792 88.935 0.12 51.75 N ATOM 8 CA THR A 42 -5.290 -13.380 89.552 0.12 50.38 C ... ENDMDL
Coordinate section: A Closer look Residue name y coordinate x coordinate z coordinate Atom name Occupancy Atom type Residue # Chain ID B-factor S.# ATOM 49 N GLY A 8 2.326 4.110 1.416 1.00 42.03 N ATOM 50 CA GLY A 8 3.121 3.079 2.065 1.00 42.27 C ATOM 51 C GLY A 8 3.533 3.408 3.476 1.00 42.32 C ATOM 52 O GLY A 8 4.302 2.642 4.092 1.00 44.09 O ATOM 53 N GLY A 9 3.080 4.526 4.038 1.00 40.18 N ATOM 54 CA GLY A 9 3.330 4.880 5.396 1.00 40.11 C ATOM 55 C GLY A 9 4.552 5.685 5.709 1.00 39.75 C ATOM 56 O GLY A 9 4.720 6.098 6.885 1.00 40.96 O ATOM 57 N ASER A 10 5.404 6.014 4.753 0.33 39.21 N ATOM 58 CA ASER A 10 6.598 6.814 5.042 0.33 38.11 C ATOM 59 C ASER A 10 6.236 8.234 5.479 0.33 36.87 C ATOM 60 O ASER A 10 5.150 8.733 5.233 0.33 32.77 O ATOM 61 CB ASER A 10 7.516 6.864 3.822 0.33 39.46 C ATOM 62 OG ASER A 10 8.894 6.884 4.237 0.33 40.79 O ATOM 63 N BGLY A 10 5.404 6.014 4.753 0.67 39.21 N ATOM 64 CA BGLY A 10 6.598 6.814 5.042 0.67 38.11 C ATOM 65 C BGLY A 10 6.236 8.234 5.479 0.67 36.87 C ATOM 66 O BGLY A 10 5.150 8.733 5.233 0.67 32.77 O Alternate conformer ID Microheterogeneity (1ENM)
Residue name y coordinate x coordinate z coordinate Atom name Occupancy Atom type Residue # Chain ID B-factor S.# ATOM 1 N GLU L 1C 63.677 26.331 17.947 1.00 31.77 N ATOM 2 CA GLU L 1C 64.338 26.818 16.736 1.00 35.78 C ATOM 3 C GLU L 1C 63.351 27.360 15.717 1.00 41.73 C ATOM 4 O GLU L 1C 63.320 28.565 15.489 1.00 49.37 O ATOM 5 CB GLU L 1C 65.320 25.825 16.101 1.00 38.64 C ATOM 6 N ALA L 1B 62.537 26.499 15.096 1.00 36.03 N ATOM 7 CA ALA L 1B 61.571 26.988 14.116 1.00 33.01 C ATOM 8 C ALA L 1B 60.631 28.018 14.729 1.00 32.42 C ATOM 9 O ALA L 1B 60.238 27.865 15.872 1.00 31.68 O ATOM 10 CB ALA L 1B 60.810 25.845 13.511 1.00 33.36 C ATOM 11 N ASP L 1A 60.262 29.089 14.012 1.00 33.13 N ATOM 12 CA ASP L 1A 59.378 30.016 14.691 1.00 35.05 C ATOM 13 C ASP L 1A 57.965 29.526 14.760 1.00 31.74 C ATOM 14 O ASP L 1A 57.476 28.873 13.851 1.00 36.72 O ATOM 15 CB ASP L 1A 59.593 31.557 14.587 1.00 41.32 C ATOM 16 CG ASP L 1A 58.724 32.268 13.564 1.00 46.17 C ATOM 17 OD1 ASP L 1A 57.452 32.455 13.924 1.00 47.60 O ATOM 18 OD2 ASP L 1A 59.188 32.658 12.472 1.00 48.99 O ATOM 19 N CYS L 1 57.321 29.802 15.860 1.00 22.52 N ATOM 20 CA CYS L 1 56.005 29.353 16.036 1.00 15.35 C ATOM 21 C CYS L 1 55.351 30.160 17.077 1.00 15.83 C ATOM 22 O CYS L 1 56.002 30.636 17.968 1.00 18.73 O Insertion codes Residue numbering (1DWD)
-snip- mmCIF format file PDB format file
80 characters wide Includes header and coordinates (x, y, z, occupancy and B-factors) for all atoms. Includes name, source and sequence of all polymers Can include a maximum of 62 chains and 99999 atoms. Free format Includes header and coordinates (x, y, z, occupancy and B-factors) for all atoms. Includes name, source and sequence of all polymers No restriction to number of chains or atoms in file. PDB Format vs mmCIF Format
Dictionaries • PDB Exchange (pdbx) dictionary • (http://mmcif.pdb.org/) • Includes the syntax, definitions, relations, boundaries • Includes examples for the contents of the mmCIF format file. • Chemical Component Dictionary • Describes all residues in the PDB files (standard, non-standard amino acids, nucleotides and other ligands - ions, drugs, cofactors, inhibitors) • 1-3 alphanumeric character identifier • Includes model & idealized coordinates for components, connectivities, name, formula, smiles strings • Maintained by the wwPDB. • Used for data processing and validation of structures
-snip- PDB Exchange Dictionary includes syntax & definitions for mmCIF format files PDB format file mmCIF format file Instance of valine matched to VAL in Chemical Component Dictionary
RasMol Chimera Pymol Jmol Webmol King Cn3D MolMol Swiss PDB viewer MolView MIDAS VMD Visualization software
Using Chimera Checklist • Upload file and Save file/image/session • Select chain/residue/atoms/neighbors • Display (and color) atoms/ ribbons/ surface/ labels • Structure analysis – measure bond lengths, angles