Simple Graph Types
Simple Graph / Chart Types Where to use them


Simple Graph Types
E N D
Presentation Transcript
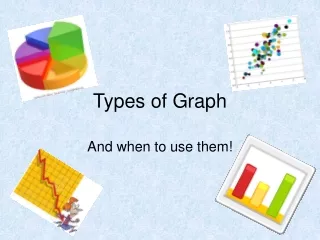
Types of Simple Graphs • Line Charts • Area Charts • Column Charts • Bar Charts • Segmented Bar / Column Charts • 100% Segmented Bar/Column Charts • Pie Charts • Doughnut Charts
Which Chart? This slide is taken from a “ must-visit ” site http://www.extremepresentation.com/
Charts shown in this presentation This slide is taken from a “ must-visit ” site http://www.extremepresentation.com/
Line Charts • Use line charts to show • Change in Variables / trends over time • Long rows of continuous data of variables • Compare and correlate two parameters over a period of time. • X axis to conventionally display time interval • Y axis to display the data variables Note : Line graph connects two actual or real data points at different time intervals. Hence, any point between the two actual or real data points should not be considered as actual value of the variable.
As Data labels may clutter the chart, a data table is used to show the variables As the data Table has the legend Included, No separate legend was given Line Chart example
Area Charts • Area Charts are similar to line charts • Use area charts to • Relative contributions over time • Show cumulated data over a period of time • Eg: YTD Sales Vs YTD Target progress • Area Charts show change in volume or quantum over time
Column Chart • Use column charts to • Display how values change over time • Compare data of single items at specific time intervals • Compare multiple sets of variables of nominal data Nominal data – e.g.: Territories, individuals etc. • Convention is - data categories on horizontal axis and the values along the vertical axis Note :If the number of time intervals or units of Nominal data are many, use line charts as the data gets cluttered and the essence of the chat may be lost
Bar Charts example • This chart type is similar to a column chart • Values are plotted horizontally rather than vertically. • Hence, more emphasis on comparison, rather than time. • Customary to arrange variables in a descending order.
Bar / Column - Sub types • Segmented Bar /Column chart • Values are stacked on each other • 100% Segmented • The percentage of each value is stacked
Segmented Column/Bar Chart • Use segmented bars or columns to... • Present a part -whole relation over time • Show proportional relationships over time • Show sub-elements which contribute to the overall column or bar and changes from one period to another. • Segmented column/bar charts are more accurate than pie chart, because distances can be more accurately estimated than areas.
Pie Chart • Use pie chart to • Compare Parts to Whole at a given point of time • Either the value or Percent to whole can be represented • Can plot only one data series as snap shot at a specific time • Ideal only if the number of categories are less than 6 Note : Too many slices in the pie can clutter a pie chart . It is customary to club many small slides in to a category called “Others”. Incase the details are needed , a combination of Pie and a Bar Char are used
Doughnut Chart • This chart is similar to a pie chart. • It shows the relationship of the parts to the whole. • In this type of chart, it is possible to chart more than one data series to compare