Different Graph Types: When and How to Use Them
130 likes | 178 Views
Learn about different types of graphs such as line, scatterplot, bar, histogram, and pie chart, their specific uses, and when to use them to effectively display data patterns and relationships. Enhance your visualization skills and choose the right graph for your data representation needs.

Different Graph Types: When and How to Use Them
E N D
Presentation Transcript
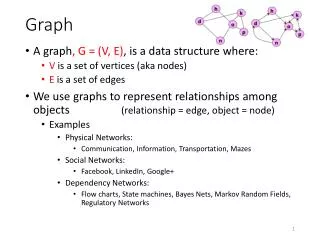
Types of Graph And when to use them!
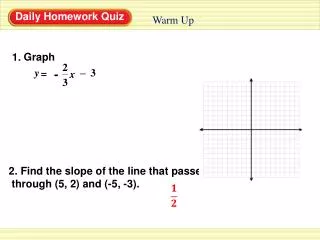
Line Graph • Used to show trends • Variable plotted on X (bottom) musts be continuous • Common type is “time series” where X = time • CANNOT be used to graph data where X is discrete
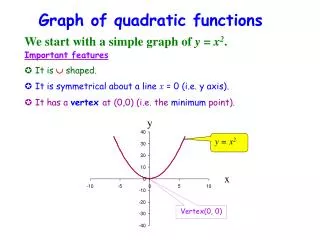
Scatterplot • Used to show relationships between variables • X variable must be continuous • If one variable is believed to cause or explain changes in the other, that variable is plotted on the X
Bar Graph • Used to compare amounts or frequencies in data that represents different categories (discrete data sets) • Categorical data set is plotted on X, quantitative (continuous) on the Y • Often used incorrectly to graph data with continuous X variables
Histogram • Used when discrete X is converted to categories (“bins”) • Y represents frequency of data within each “bin”
Pie Chart • Used for same kind of data as bar chart • Each slice = data category • Slice size shows relative proportion of observations within each category