Download
1 / 25

E N D
Read me Today, we have abundant data, better information, fair knowledge and poor insight. Encountering wisdom is a rare occurrence! The data is out there on our spreadsheets, databases and hard disks. Here are 20 simple effective metrics for a Sales manager and a Brand Manager. It is not all these metrics, probably an ideal combination of one or two of these metrics for a given business problem can show a direction - The right direction. The wisdom is finding out the combination. I leave the choice to you. Lastly, as some one aptly puts it, • A collection of data is not information. • A collection of information is not knowledge. • A collection of knowledge is not wisdom. • A collection of wisdom is not truth.
Metric • A metric is a system of related measures that facilitates the quantification of some particular characteristic • Remember , • What gets measured , gets done. • If you cannot measure it, You cannot manage it
Few definitions in brief • Market : Segment and Category makes a Market • Segment : People with similar needs • Made up of people or organizations sharing one or more characteristics that cause them to demand similar product and/or services • Category : Inter changeable brands or service • A category is a group or set of things that have similar characteristics. Similar and competing products (or services) all fall into the same brand category.
11.Market Share 12.Relative Market share 13.Evolution Index 14.Market contribution Index 15.Rate of Cannibalization 16.COGS 17.Gross Margin and Profit 18.ROI 19.Performance Spread 20.Performance Span 20 Metrics at a glance • 1.Target achievement • 2.Incremental and Growth • 3.CAGR • 4.Per capita per month • 5.Contribution percent • 6.Incremental contribution • 7.Contribution Index • 8.YTD • 9.MAT • 10.Simple Moving Average
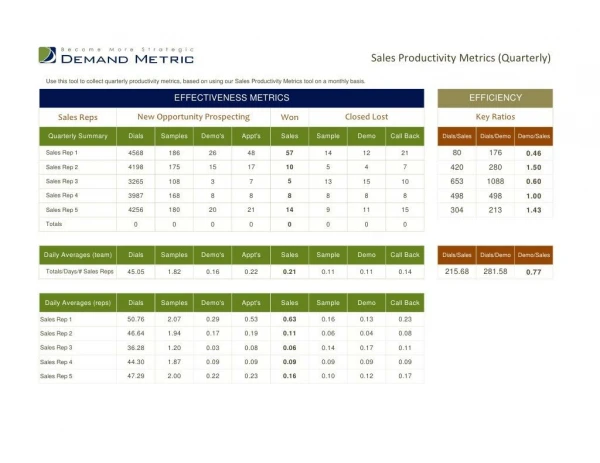
1.Target achievement • Achievement vs. the Target • This can be measured at a specific time interval like Month, Quarter, Half-Yearly, Yearly, YTD (Year to date) etc. • Use: To measure sales success Total sales for the period Target achievement = Total Target for the period
2.Incremental and Growth • Incremental: Absolute incremental in revenue compared to last period (Month, Qtr,Year etc.) • Growth : Incremental as a percent to last period’s revenue is growth. • Use: Measure the health of a brand or a organization Vs. Market competition This year sales – Last year sales Growth = Last year sales
3.CAGR (Compounded Annual Growth Rate) • CAGR the year-over-year average growth rate over a specified period of time. • It is best explained if you understand what is not CAGR! • Suppose you have started your sales with Rs.100 in 1st year and ended up with Rs.364.65 in 4th year. You have grown at 70%,50%,30% and 10% respectively in 4 Years. If some one asks you on an average what is the growth per year, it is not the average of 70+50+30+10 divided by 4 = 40%. • This is where CAGR is used. You will find it as ~ 38.1876%. 1 Total No. Yrs End Sales - 1 CAGR = Start Sales
4.Per Capita Per Month • This is to measure average sales by each sales man per month • Use: This gives a quantum of sales contribution per salesman. Can be used to compare productivity Average sales per month PCPM = Number of Salesmen
5.Contribution Percent • This is to measure the percent of contribution from each entity like salesman / Territory/ Brand to the total sale. • Use: To measure the degree of dependence on a brand / Territory /Salesman to the total sales Sale of the identified entity Contribution % = Total sales of all entities
6.Incremental Contribution • This is to measure the percent of contribution from each salesman / Territory/ Brand to the total Incremental sale. • Use: To measure the degree of dependence on a brand / Territory /Salesman to the total Incremental sales / Revenue Incremental Sale of entity Incremental Contribution = Total Incremental sales of all entities
7.Contribution Index • Is a number that denotes the number of times the average contribution of each entity like territory / Salesman and Brand sales • Use: To measure the relative contribution of each entity to the average • If it is more than 1, the Contribution is above the average of all, if equal it is on par else it is less than the average of all. Sale of the entity Contribution Index = Average sales of all entities
8.YTD • YTD : Year to Date (Similarly QTD and MTD) • Revenue/Sales form the beginning of the year • E.g.On 31st March 2010 YTD sales means, sales from 1st Jan 2010 to 31st Mar 2010 • Use : Measure the sales quantum at a specific point of time YTD Apr 2010 = Jan -10 + Feb-10 + Mar-10 + Apr-10 (sales) MTD – 4/Jun/2010 = 1-Jun + 2-Jun + 3-Jun + 4-Jun (sales)
9.MAT • MAT : Moving Annual Total • Last 12 months Revenue/sales • E.g.: Feb 2009 to Jan 2010 sales are called MAT Jan 2010 Sales • Use: As it data is for the past 12 months, comparing two points of MAT data evens out the fluctuations MAT Jan-10 = Feb-09 + Mar-09 +……+ Dec-09 + Jan-10 MAT Jun-10 = Jul-09 + Aug-09 +……+ May-10 + Jun-10
10.Simple Moving Average • Also called as rolling/running average, is a series of numbers • Commonly used with time series data to smooth out short-term fluctuations and highlight longer-term trends. • E.g.: Take the sales of the last 20 days, add them and divide the total by 20. • Next day, take last 20 days average, next day again last 20 days average. • The resultant series is a simple 20 day moving average. 1 day to 20 day sales average, 2 day to 21 day sales average, 3 day to 22 day sales average,4 day to 23 day sales average,.. SMA of sales (20 Days) =
11.Market share of a brand • Expressed in percentage • Can be in Units and also in Revenue • Market is the defined market for the brand Total sales of the brand Market Share % = Total sales of the market
12.Relative Market share Index • Expressed as a number • Comparing brand market share with the biggest competitor’s market share • Can be measured for units as well as revenue Brand Market Share Relative Market Share Index = Brand leader’s Market share
13.Evolution Index • Evolution Index is a number that denotes the rate of brand growth vs. the market Growth in a given geography • If the resultant index is more than 1,the brand is growing faster than the market. if equal it is on par with the market • Use: To determine the growth of a brand relative to market 100 + ((Brand Growth%) X 100) Evolution Index = 100 + (Market Growth%) X 100)
14.Market Capitalization Index • Market Capitalization Index (MCI) is a number that denotes the degree of market captured by the brand in a given geography • Use: This measure can give indication of opportunity realized and opportunity in waiting in a given geography Brand Contribution% of a geography MCI = Market Contribution% of a geography
15.Rate of Cannibalization • Cannibalization is a process where the new introduction (say the line extension of a brand) eats in to sales of the existing brand ( say the Mother brand) from the same organization. • Use: To measure to assess the impact of new introduction on the existing brand Sales loss (Actual or Expected ) from Existing brand Rate of Cannibalization = Sales of new Introduction
16.COGS – Cost of Goods Sold • The total of direct expenses incurred in producing goods.Includes the actual cost of materials, direct labor costs in making the goods in saleable condition. • COGS does not include indirect expenses such as advertising and promotion , sales force costs, office or administrative , accounting expenses, royalties, rent etc. COGS = Actual Manufacturing Cost + Packing Costs + Transport Costs Inventory Costs are also taken by some organization as a part of COGS
17.Gross Margin % ; Gross profit • Gross Margin is the difference between revenue and COGS • Gross profit is the difference between revenue and the COGS, before deducting payroll costs ,overhead costs, interest and taxation. Revenue - COGS Gross Margin % = Revenue Gross profit = Net sales – Cost of goods sold (COGS)
19.Performance Spread • Spread is measure how many entities* have performed on or above the benchmark ? * Entities can be salesman, brands, SKUs, territories, areas etc • Spread is often measured at a specific point of time like Month ,Qtr, Year etc. • Use: to measure dispersion of Success among entities Spread* = No of entities above benchmark : Total No. of entities * Spread Best expressed as Ratio than a percent for a better understanding. * Spread is at a specific point of time, hence showing the point of time is essential ( Like YTD Jan 2010)
20.Performance Span • Measure of How often the performance is on or above benchmark in a given time frame is Span. • Measured for a time frame like Jan-Dec,Day1-Day31 etc. • Use: To measure dispersion of success across time frame and also predictability of success and risk. Span* = No of months above bench mark : Total no. of months * Span is best expressed as Ratio than a percent for a better understanding. * Span for a given time interval, hence showing the time interval is essential ( Jan 2010 to Dec 2010)