Download
1 / 10
100 likes | 195 Views
This overview highlights the advances made in forecasting skills from 1981-2003, focusing on the 5-km hemispheric flow pattern by ECMWF. It also discusses the increased evidence of human impact on the environment, such as the Antarctic ozone hole and greenhouse warming. The text delves into the decline of CCL4 mixing ratio and aerosols, along with the links to climate dynamics like Arctic sea ice anomalies and projected future scenarios. Furthermore, it explains the observed increase in Arctic surface air temperatures and projected declines in sea ice extent.

E N D
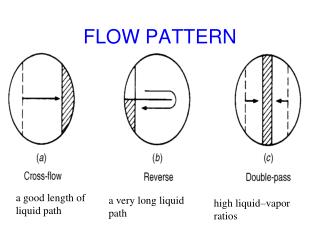
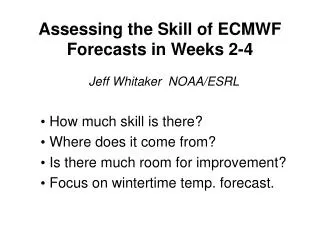
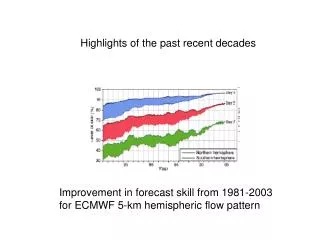
Highlights of the past recent decades Improvement in forecast skill from 1981-2003 for ECMWF 5-km hemispheric flow pattern
Increased evidence of human impact:Antarctic ozone hole TOMS (Total OzoneMapping Spectrometer) satellite
CCL4 mixing ratio declining, also that of other ozone-depletors
Increased evidence of human impact: Greenhouse Warming Carbon Dioxide Monthly-mean C02 concentrations, 1958-2002
Links to Climate Dynamics: The Arctic Fig. xx, left panel: Sea ice concentration Anomalies for September 2002, 2003, and 2004, along with the 1979-2000 median September ice edge (pink line), derived from passive microwave satellite imagery. These reveal that sea ice extent reached a record minimum in Sept. 2002, followed by two more low-ice years. While sea ice decline can result from natural variability associated with the dynamical Arctic Oscillation (AO), greenhouse warming also favors the AO phase most conducive to warming. Image courtesy of NSIDC, Boulder, CO (http://nsidc.org/) Arctic surface air temperatures have observed to increase in the past 50 years in Alaska and Siberia, with a cooling in Southern Greenland. Additional declines of roughly 10-50% in annual average sea-ice extent are projected by 2100 in model simulations. Loss of sea ice is projected to be greater during summer than in the annual average. Top and left Figures provided by The Arctic Climate Impact Assessment (http://www.acia.uaf.edu).
Overview of the atmosphere: Coordinate System Convention dx = r dcos dy = r d is longitude, is latitude x positive east, y positive north 1 degree latitude = 111 km at greenwich
Atmosphere very thin: 99.9% of air • Mass in a layer < 1% of Earth’s radius • r approximated as the Earth’s radius ~ 6.37 * 106 m