Download
1 / 49
500 likes | 656 Views
2011 PBIS National Forum: Implementing Innovation for a Lasting Effect. Steve Adamowski The role of School Climate. NW PBIS Leadership Forum. Taking PBIS to Scale with Fidelity, Depth and Impact. School-wide Positive Behavioral Interventions and Supports (SWPBIS).

E N D
2011 PBIS National Forum: Implementing Innovation for a Lasting Effect
SteveAdamowskiThe role of School Climate NW PBIS Leadership Forum
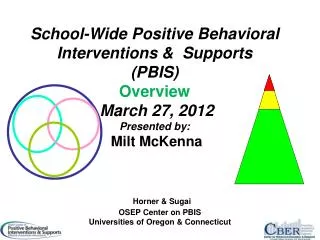
School-wide Positive Behavioral Interventions and Supports (SWPBIS) • The social culture of a school matters. • A continuum of supports that begins with the whole school and extends to intensive, wraparound support for individual students and their families. • Effective practices with the systems needed for high fidelity and sustainability • Multiple tiers of intensity
School-wide PBIS • Establishing additional supports for students with more intense needs
Count of School Implementing SWPBIS by State August, 2011 12 States with 500 or more schools implementing SWPBIS
States Participating • Florida, Illinois, North Carolina, Missouri, Maryland, Colorado, Oregon • Don Kincaid1, Rob Horner2, George Sugai3, Tim Lewis4, Lucille Eber5, Susan Barrett6, Celeste Rossetto Dickey2, Mary Richter4, Erin Sullivan7, Cyndi Boezio7, Bob Algozzine8 Heather Reynolds8, Nancy Johnson4
Visibility Political Support Funding Policy Leadership Team Active Coordination Training Coaching Behavioral Expertise Evaluation Local School/District Teams/Demonstrations Sugai et al., www.pbis.org
2 – 4 Years Stages of Implementation • Exploration • Installation • Initial Implementation • Full Implementation • Innovation • Sustainability Implementation occurs in stages: Or more Fixsen, Naoom, Blase, Friedman, & Wallace, 2005
Stages of Implementation Steve Goodman Should we do it Getting it right Making it better
Exploration Continuous Improvement Initial Efforts Elaboration
Scaling up School-wide Positive Behavioral Interventions and Supports:The Experiences of Seven States with Documented SuccessDon Kincaid, Rob Horner, George Sugai, Tim Lewis, Lucille Eber, Susan Barrett, Celeste Rossetto Dickey, Mary Richter, Erin Sullivan, Cyndi Boezio, Bob Algozzine, Heather Reynolds, Nancy Johnson
Descriptive Summary: Oregon Exploration / Installation / Initial Imp /Full Imp & Innovate
Descriptive Summary: Missouri Exploration / Installation /Initial Imp / Full Imp & Innovate
Descriptive Summary: North Carolina Exploration / Installation / Initial & Full Imp / Innovate
Descriptive Summary: Colorado Exploration / Installation / Initial & Full Imp / Innovate
Descriptive Summary: Florida Exploration/ Installation/ Initial Imp / Full Imp / Innovate
Descriptive Summary: Maryland Exploration / Installation / Initial Imp / Full Imp / Innovate
Descriptive Summary: Illinois Exploration / Installation / Initial Imp /Full Imp & Innovate
Lessons Learned • Multiple approaches to achieving scaled implementation • Colorado: Started with Leadership Team • Illinois: Started with Leadership Advocates and built a state leadership team only after initial implementation success was documented. • All states began with small “demonstrations” that documented the feasibility and impact of SWPBIS. • Central role of coordinators (advocate) during Exploration and Installation. • Only when states reached 100-200 demonstrations did scaling occur. Four core features needed for scaling: • Administrative support/ Funding • Technical capacity (Local training, coaching and behavioral expertise) • Local Demonstrations of feasibility and impact • Evaluation data • Essential role of Data: Fidelity data AND Outcome data
Administrative Support/Funding • A leadership team is helpful but not essential for initial demonstrations. • But an active leadership team may be critical for sustainability and scaling • Funding initial demonstrations can occur via many forms, including external grants. • Scaling and sustainability require reallocation of existing program funds (e.g. professional development, related services, evaluation)
Technical Capacity(training, coaching, behavioral expertise, evaluation) • Every state starts with important “excellence” in some of the core technical capacity areas. • Invest in building technical capacity WHILE building initial demonstrations • Trainers (5 state trainers) • Coaching cadre (multiple coaches per district) • Behavioral expertise (per district) • Establish people who can both DO IT and TEACH IT • Evaluation
Local Demonstrations • Documented Feasibility • Impact (ODRs, Academic Gains, Staff turnover) • Practical materials the make next implementation easier • Teaching matrix • Reward systems • Staff buy-in • Administrator support • Family engagement
Evaluation • Start by building evaluation systems that work at the individual student/school level. • Selection of measures • Collection and use of data • Use Evaluation to Assess Fidelity, Impact, and Equity • Are we implementing with fidelity? • Is implementation benefiting students? • Is it working for everyone? Algozzine et al., SWPBIS Evaluation Blueprint pbis.org
Fidelity Measures within SWPBIS • SECONDARY &TERTIARY PREVENTION • Individual Student System Evaluation Tool (ISSET)– RESEARCH • Monitoring Advanced Tiers (MATT) – PROGRESS • Benchmark of Advance Tiers (BAT) -- ANNUAL Bully Prevention Check-in Check-out Check and Connect Second Step First Step for Success Reading First Math Counts Classroom Management ~5% ~15% • PRIMARY PREVENTION • School-wide Evaluation Tool (SET) – RESEARCH • Team Implementation Checklist (TIC) – PROGRESS • Benchmark of Quality (BoQ) – ANNUAL SUSTAINABILITY ~80% of Students
Using Fidelity Data Assessing the extent to which we are implementing what we claim to implement Use of the data for decision-making
Questions to Ask of the Data What is? What is typical? What is possible? What is needed? Compare with National Median 150 / 100 = 1.50 1.50 X .22 = .33 Elementary School with 150 Students Newton, J. S., Todd, A. W., Algozzine, K., Horner, R. H., & Algozzine, B. (2009). The Team Initiated Problem Solving (TIPS) Training Manual. Educational and Community Supports, University of Oregon, unpublished training manual.
Elementary School 465 students (465/ 100 = 4.6 X .22= 1.01) Newton, J. S., Todd, A. W., Algozzine, K., Horner, R. H., & Algozzine, B. (2009). The Team Initiated Problem Solving (TIPS) Training Manual. Educational and Community Supports, University of Oregon, unpublished training manual.
Newton, J. S., Todd, A. W., Algozzine, K., Horner, R. H., & Algozzine, B. (2009). The Team Initiated Problem Solving (TIPS) Training Manual. Educational and Community Supports, University of Oregon, unpublished training manual.
Newton, J. S., Todd, A. W., Algozzine, K., Horner, R. H., & Algozzine, B. (2009). The Team Initiated Problem Solving (TIPS) Training Manual. Educational and Community Supports, University of Oregon, unpublished training manual.
Tier I Risk Tier II Risk Tier III Risk Literacy Risk
Elementary Schools:Compare proportion of students enrolled to proportion of students with an ODR % Enrolled % with an ODR
Middle Schools:Compare proportion of students enrolled to proportion of students with an ODR % Enrolled % with an ODR
Main Messages: • Reduction in ODRs occurred for all ethnic groups • Racial disproportionality continued, however, just at a lower level of intensity. Preliminary Evidence:When PBIS is linked to reduction in ODRs does reduction occur for students from all ethnic groups? From: Vincent, Cartledge, May & Tobin, 2009
Implications for Scaling SWPBIS • Consider where your state is currently, and what it would take to move to scaling • Attend to “implementation variablesand stages” • Timing makes a difference (2-4 years may be too few) • Invest in a state leadership team • Political • Technical • Fiscal • Cultural
Implications for Scaling SWPBIS • Build capacity for scaling (training, coaching, evaluation, technical expertise) WHILE establishing initial demonstrations. • Plan for 100-200 demonstrations (or more) before achieving the administrative support and funding for scaling. • Remember that there are always different ways (different paths) to achieve the core features/outcomes.
Values Science Practices that affect quality of life Practices that work PBIS Vision Practices that are practical, durable and available