Download
1 / 24
240 likes | 516 Views
Predicting volatility: a comparative analysis between GARCH Models and Neural Network Models. MCs Student: Miruna State Supervisor: Professor Moisa Altar - Bucharest, June 2002 -. Contents. Introduction Models for return series GARCH models Mixture Density Networks Aplication and results

E N D
Predicting volatility: a comparative analysis between GARCH Models and Neural Network Models MCs Student: Miruna State Supervisor: Professor Moisa Altar - Bucharest, June 2002 -
Contents • Introduction • Models for return series • GARCH models • Mixture Density Networks • Aplication and results • Conclusion and further research • Selective bibliography Doctoral School of Finance and Banking
1. Introduction • Concepts of risk and volatility • Objective: compare the GARCH volatility models with neural network based models for modeling conditional density Doctoral School of Finance and Banking
2. Models for time series returns • 2.1 ARCH(p) models Doctoral School of Finance and Banking
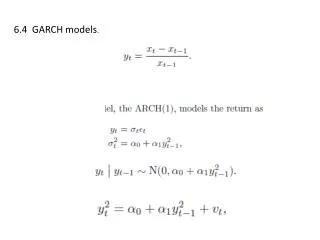
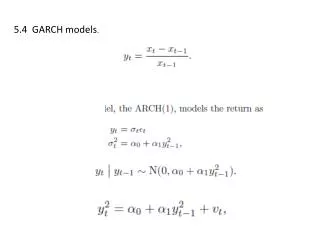
2.2 GARCH (p,q) GARCH(1,1) Doctoral School of Finance and Banking
GARCH (1,1) it can be written as an infinite ARCH model : The unconditional variance from the GARCH (1,1) Doctoral School of Finance and Banking
2.3 Mixture Density Networks • Venkatamaran (1997), Zangari (1996) -used unconditional mixture densities for calculating VaR • Lockarek-Junge and Prinzler (1998) -used one neural network to model the density conditionally • Schittenkopf and Dorffner(1998, 1999) - concentrated on the performance of the of neural network based models to estimate volatility Doctoral School of Finance and Banking
Mixture Densities • the random variable is drawn from one out of many possible normal distributions • allows for heavy tails • preserves some convenient characteristics of a normal distribution Doctoral School of Finance and Banking
Neural Networks • have been used for medical diagnostics, system control, pattern recognition, nonlinear regression, and density estimation • relates a set of input variables xt t=1,…,k, to a set of one or more output variables, yt, t=1,…,k • it is composed of nodes Doctoral School of Finance and Banking
three common types of non-linearities used in ANNs Doctoral School of Finance and Banking
Multi-Layer Perceptron (MLP) • has one hidden layer The mapping performed by the MLP is given by Doctoral School of Finance and Banking
Mixture Density Network • combines a MLP and a mixture model • the conditional distribution of the data -expressed as a sum of normal distributions Estimation of MDN - by minimizing the negative logarithm of the likelihood function - by using backpropagation gradient descendent algorithm Doctoral School of Finance and Banking
RPROP algorithm • partial derivative of a weight changes its sign - the update value is decreased by a factor η- • If the derivative doesn’t change its sign - slightly increase the update value by the factor η+ • 0< η- <1< η+ • η+=1.2 • η-=0.5 Doctoral School of Finance and Banking
3. Application and results • Data used • daily closing values of the BET-C from 17.04.1998 to 10.05.2002 • Returns calculated as follows: rt= ln(Pt/Pt-1) • Two data sets: - a training one - a testing one • Softwere used: Eviews, Matlab Netlab Doctoral School of Finance and Banking
GARCH Estimation The daily BET-C returns Histogram of the returns series Doctoral School of Finance and Banking
Mean equation Doctoral School of Finance and Banking
ARCH LM test for serial correlation in the residuals from the mean equation Doctoral School of Finance and Banking
Estimation of GARCH (1,1) Doctoral School of Finance and Banking
MDN Estimation • feed forward single-hidden layer neural network • 4 hidden units • 3 Gaussians • m-dimensional input xt-1,…,xt-m • 3n dimensional output : weights, conditional mean, and conditional variance Doctoral School of Finance and Banking
Evaluation of the models • Normalized mean absolute error • Normalized mean squared error Doctoral School of Finance and Banking
Hit rate • Weighted hit rate Doctoral School of Finance and Banking
Results Doctoral School of Finance and Banking
4. Conclusion and further research • Recurrent neural networks • The structure of the network used • Trading or hedging strategies • Methodoligies for measuring market risk Doctoral School of Finance and Banking
5. Selective bibliography • Bartlmae, K. and R.A. Rauscher (2000) – Measuring DAX Market Risk: A Neural Network Volatility Mixture Approach,www.gloriamundi.org/var/pub/bartlmae_rauscher.pdf. • Bishop, W. (1994) - Mixture Density Network, Technical Report NCRG/94/004,Neural Computing Research Group, Aston University, Birmingham, February . • Jordan, M. and C. Bishop (1996)– Neural Networks, in CDR Handbook of Computer Science, Tucker, A. (ed.), CRC Press, Boca Raton. • Locarek-Junge, H. and R. Prinzler (1998) - Estimating Value-at-Risk Using Neural Networks, Application of Machine Learning and Data Mining in Finance, ECML’98 Workshop Notes, Chemnitz. • Schittenkopf, C. and G. Dockner (1999) – Forecasting Time-dependent Conditional Densities: A Neural Network Approach, Vienna University of Economic Studies and Business Administration, Report Series no.36. • (1998) – Volatility Prediction with Mixture Density Networks, Vienna University of Economic Studies and Business Administration, Report Series no.15. • Venkatamaran, S. (1997) – Value at risk for a mixture of normal distributions: The use of quasi-Bayesian estimation techniques, Economic Perspectives (Federal Bank of Chicago), pp. 3-13. • Zangari, P. (1996)- An improved methodology for measuring VaR, in RiskMetrics Monitor 2. Doctoral School of Finance and Banking