Location
Solar zenith angle = 37°. Plant Survey & Mapping. (b). (a). Solar zenith angle = 48°. Views of the plants in plot #108 (dense snakeweed) generated at various viewing and illumination angle configurations by Radiosity-Graphics Method.

Location
E N D
Presentation Transcript
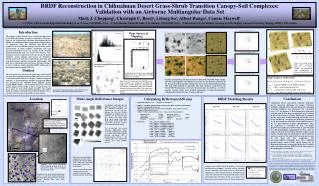
Solar zenith angle = 37° Plant Survey & Mapping (b) (a) Solar zenith angle = 48° Views of the plants in plot #108 (dense snakeweed) generated at various viewing and illumination angle configurations by Radiosity-Graphics Method. Sample field data sheet for the small plant (understory) survey (dimensions of all the plants were recorded). (c) Solar zenith angle = 60° Simple Geometric Model (SGM): R=GWalt(Ji,Jv,j).kG(Ji,Jv,j)+CRoss(Ji,Jv,j).kC(Ji,Jv,j) GWalt = soil/litter BRDF via the Walthall model CRoss = Ross’ turbid medium function kG , kC = proportions sunlit ground, crowns [3]. Ji,Jv,j = sun and view zenith, relative azimuth angles Map of one 25 m2 plot near the JORNEX grass-shrub transition site, showing the locations and heights in cm of large shrubs (grey polygons) and the locations of small plants (dots) such as broom snakeweed (Gutierrezia sarothrae). The snakeweed are sparse in this plot relative to other plots in the vicinity. Ground-level field photographs of the transition site in the antisolar (top) and solar (bottom) directions. Canada United States Frequency distribution of plant heights in three 25m2 plots. Jornada Range Mexico 500 km 500 miles 500 m Mean Reflectance Spectra for Snakeweed and Mormon Tea 3000 m Mean Spectral Reflectance Observed (Duncan camera) Reflectance RGM w/non-Lambertian soil SGM (h/b=2.92) Soil BRDF (Walthall) RGM, No snakeweed BRDF Reconstruction in Chihuahuan Desert Grass-Shrub Transition Canopy-Soil Complexes: Validation with an Airborne Multiangular Data Set Mark J. Chopping1, Christoph C. Borel2, Lihong Su3, Albert Rango1, Connie Maxwell1 1: USDA, ARS Jornada Experimental Range, Las Cruces, NM 88003, USA 2: Los Alamos National Labs., Los Alamos, NM 87545, USA 3: Research Ctr. for Remote Sensing & GIS, Beijing Normal University, Beijing 100875, P.R. China Introduction The objective of this research was to evaluate the importance of the different elements (overstory, understory, soil, grass, litter) in the bi-directional reflectance distribution function (BRDF) of a Chihuahuan Desert grass-shrub transition zone, by simulations using the POVRAY and RGM 3-D graphics/raytracing/radiosity packages [1], driven by explicit measurements of plant locations, dimensions and type surveyed exhaustively in two 25 m2 plots in the Jornada Experimental Range near Las Cruces, New Mexico, USA. Transition zones are characterized by an overstory of shrubs (mesquite, acacia, ephedra and yucca); an understory (broom snakeweed with other small shrubs and forbs and some grama grass); and bare soil (mostly rather sandy). The goal was to understand better the factors driving reflectance in order to improve simple, invertible BRDF models such as the simple geometric model (SGM [2]). Method The 3-D models were driven by the plant maps and the SGM was driven by mean plant density, radius and crown vertical to horizontal radius ratio for each plot, calculated using the field data. A non-Lambertian soil/litter ‘background’ BRDF was provided by the Walthall model, adjusted against ground BRDF samples. The modeled values were assessed against samples of the BRDF at 650 nm acquired from the air at up to six view zenith angles and three solar zenith angles by a tilting, calibrated Duncan MS2100 digital camera (not all locations were provided with 18 observations). Top left: Aerial photograph chips (0.33 m) for plots #107 and #108. Right column: plot #107 representation with modeled crowns for two sun positions generated by the Forester/POVRAY package. Bottom left: views of the modeled plants in plots #107 and #108 modeled as spheroids and their shadows, generated by the Forester/POVRAY package. The soil colors given here are arbitrary. As with L-systems, Forester allows more detailed descriptions of plant physiognomies, including specification of leaves, branches and stems. Location Multi-Angle Reflectance Images Calculating Reflectance(650 nm) 1. skylight:directlight = 1:12 skylight + directlight = 1; 2. SOILref = soil BRDF (Walthall model calibrated with BRFs from Grassland PROVE); GUSAref = Snakeweed reflectance; PRGLref = (Mesquite_leaf_reflectance x 10 + Mesquite_stem_reflectance)/11.0; EPTOref = Ephedra reflectance; YUELref = (Yucca_leaf_reflectance x 3 + Yucca_stem_reflectance)/4.0; Mesquite_leaf = 0.095 Mesquite_stems = 0.075 Yucca_leaf = 0.095 Yucca_stems = 0.140 Snakeweed = 0.110 Ephedra = 0.200 Mesquite leaf:stem = 10:1 Yucca leaf:stem = 3:1 3. reflectance = snlt__soil x (1-skylight) x soilref +snlt__GUSA x (1-skylight) x GUSAref +snlt__PRGL x (1-skylight) x PRGLref +snlt__YUEL x (1-skylight) x YUELref +snlt__EPTO x (1-skylight) x EPTOref +shde__soil x skylight x soilref +shde__GUSA x skylight x GUSAref +shde__PRGL x skylight x PRGLref +shde__YUEL x skylight x YUELref +shde__EPTO x skylight x EPTOref BRDF Modeling Results Conclusions Chihuahuan Desert grass-shrub transition landscapes present important challenges for canopy reflectance modeling. Although soil is the most important component governing brightness and anisotropy, with a fractional cover > 0.7, the presence of black grama grass (Bouteloua eriopoda) and its litter plays an important role in relation to that of the overstory of larger shrubs such as mesquite and the understory of small forbs and sub-shrubs such as broom snakeweed. Assigning the understory proportions to soil has a small but noticeable effect, mainly because of the very large numbers of plants (380-660/25m2). Since the understory is accounted for here, the higher proportion of grama grass and its litter in plot 108 seems to be the most plausible explanation for the lower observed values in the forward-scattering direction relative to the models. Models must not only include a non-Lambertian soil and account for the understory but must also account for the grass and litter components. The raytracing/radiosity simulations show that a simplified geometric-optics model (SGM) closely follows the bi-directional reflectance values predicted by the 3-D models, with a maximum absolute RMSE of 0.038 with respect to the multiangular observations. [1] Qin, W., and Gerstl, S. A. W. (2000), 3-D scene modeling of Jornada semi-desert vegetation cover and its radiation regime. Remote Sens. Environ. 74:145–162. [2] Chopping M.J., Rango, A., Havstad, K.M., Schiebe, F.R., Ritchie, J.C., Schmugge, T.J., French, A., McKee, L., and Davis, R.M. (2002), Canopy attributes of Chihuahuan Desert grassland and transition communities derived from multi-angular 0.65µm airborne imagery, unpublished manuscript. [3] Wanner, W., X. Li, and A. H. Strahler (1995), On the derivation of kernels for kernel-driven models of bidirectional reflectance, Jnl. of Geophysical Research, 100:21077-21090. Overlapping multi-angle spectral reflectance images (650nm) over the JORNEX transition site, aligned here so that each row (column) has the same latitude (longitude). In reading order the VZA/SZA for the target centres are: -19/38, -7/38, 2/38, 15/38, 29/38; -36/49, -20/49, -2/49, 14/49, 35/49, 40/49; -35/59, -28/59, -9/59, 2/59, 19/59 and 26/59. Negative values indicate backscattering. The co-registered 2m ground resolution multiangular images were used to simulate the response of a sensor with a 50m footprint through convolution with a pseudo-Gaussian kernel. The resulting data were subsequently mapped at a 25m sampling interval. SZA=38° SZA=49° SZA=59° Landsat TM5 NDVI image 09/25/95 of the USDA, ARS Jornada Experimental Range, New Mexico, pastures outlined in blue, roads in red (center = 106.9°W 32.5°N). Polar plot of a typical angular sampling at the center of the target area provided by flights at three times of day (providing observations at three solar zenith angles). The observations marked with a square and circle were acquired at a hot spot and a specular geometry, respectively. Acknowledgments: the staff of the USDA, ARS Jornada Experimental Range (Eddie Garcia, Jim Lenz, Dave Thatcher and Rob Dunlap); Wenhan Qin at Science Systems and Applications, Inc., Lanham, MD; Betty Walter-Shea at the School of Natural Resource Sciences at the University of Nebraska-Lincoln; and Jerry C. Ritchie, Charlie Walthall and Rob Parry at the USDA, ARS Hydrology and Remote Sensing Laboratory, Beltsville, MD. Transition Zone aerial photograph (0.33m) showing location of the 3 x 3 grid of 25 m2 plots. Note the brighter areas along the roads. Example results of RGM and SGM modeling -- both using a non-Lambertian soil BRDF -- compared with the soil BRDF function, multiangle observations from the tilted Duncan MS2100 camera observations from the air, and RGM with no snakeweed. Modeling was for (top) plot #107 (sparse GUSA) and (bottom) plot #108 (dense GUSA) at the angles of the Duncan observations, mostly within 35° of the principal plane. Transition Zone, aerial photograph (0.33m) of the 3 x 3 grid of 25 m2 plots (numbered). The large dark objects are honey mesquite shrubs. Mottled areas have more snakeweed. Data from the JORNEX campaign of September 2000 Courtesy Dr. Jerry C. Ritchie.