2010 Groen Beursjaar
70 likes | 181 Views
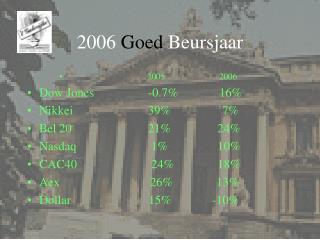
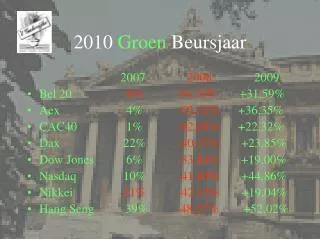
2010 Groen Beursjaar. 2007 2008 2009 Bel 20 -6% -54,76% +31,59% Aex 4% -52,32% +36,35% CAC40 1% -42,68% +22,32% Dax 22% -40,37% +23,85%

2010 Groen Beursjaar
E N D
Presentation Transcript
2010 GroenBeursjaar 2007 2008 2009 • Bel 20 -6%-54,76% +31,59% • Aex 4% -52,32% +36,35% • CAC40 1% -42,68% +22,32% • Dax 22% -40,37% +23,85% • Dow Jones 6% -33,84% +19,00% • Nasdaq 10% -41,89% +44,86% • Nikkei -11%-42,12% +19,04% • Hang Seng 39% -48,27% +52,02%
En nog 2008 2009 S&P 500 -38% +24,28% Buffet -32% +2,7 % Brazilië (Bovespa) +83% (+136%€) Rusland (RTS) +129% (+121%€) China (CSI300) +96% (+90%€) India (Sensex) +81% (+83%€)
En WIJ? ‘t Galerijke Winst/Verlies • Punt 2001 18,43 • Punt 200215,95 -13,5% • Punt 2003 19,18 +20,3% • Punt 2004 22.43 +16,9% • Punt 2005 28.38 +26,5% • Punt 2006 33.35 +17,5% • Punt 2007 37,02 +11,1% • Punt 200825,54-31,0% • Punt 2009 30,17+18,1%
Verkochte Toppers / Floppers 2009? Rentes 2.323 € Dividenden 936 € Thrombogenics 6,82 14,86 4.020 € Sipef 17,2 34,87 2.297 € RHJI 3,51 4,88 1.890 € Harmony 1.507 € Option Trading 1,02 3,35 1.281 € Petrofac 3,44 8,79 £ 1.083 € Solvay 60,5 71,01 887 € Total 37,91 40,40 222 € Sinds financieel verslag 2008/12
Verkochte Toppers / Floppers 2009? Punch 32,51 7,62 -1.393 € Accentis 0,17 0,03 -1.270 € KBC Almanco 11,95 3,2 - 586 € Metris 1,8 1,05 - 465 € E.ON 28,82 27 - 309 € ETFS Crude 17,73 16,93 - 221 € Sinds financieel verslag 2008/12
En willen wij in 2010? WINST - WINST - WINST