Download
1 / 1
10 likes | 143 Views
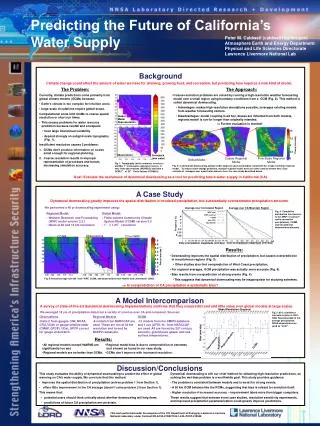
Predicting the Future of California’s Water Supply. Peter M. Caldwell (caldwell19@llnl.gov) Atmosphere Earth and Energy Department Physical and Life Sciences Directorate Lawrence Livermore National Lab. Background.

E N D
Predicting the Future of California’s Water Supply Peter M. Caldwell (caldwell19@llnl.gov) Atmosphere Earth and Energy Department Physical and Life Sciences Directorate Lawrence Livermore National Lab Background Climate change could affect the amount of water we have for drinking, growing food, and recreation, but predicting how requires a new kind of model. • The Problem: • Currently, climate predictions come primarily from global climate models (GCMs) because: • Earth’s climate is too complex for intuition alone. • large-scale circulations require global scope. • Computational costs limit GCMs to coarse spatial resolution or short run times. • This causes problems for water resource prediction because rainfall and snowpack: • have large interannual variability • depend strongly on subgrid-scale topography (Fig. 1). • Insufficient resolution causes 2 problems: • GCMs don’t produce information on scales small enough for regional planning. • Coarse resolution results in improper representation of processes and terrain, decreasing simulation accuracy. • The Approach: • Coarse-resolution problems are solved by running a high-resolution weather forecasting model over a small region using boundary conditions from a GCM (Fig. 2). This method is called dynamical downscaling. • Advantages: makes high-resolution simulations possible, leverages existing models from weather forecasting centers. • Disadvantages: model coupling is ad hoc, biases are inherited from both models, regional model is run for longer than originally intended. • Further evaluation is merited! 1500 1000 Global Model Representation 500 10 7.5 5 2.5 0 2000 1500 Precip (mm/day) 3000 500 Coarse Regional Model Fine-Scale Regional Model Global Model 500 Observations Snowpack (mm water) Fig. 2: In dynamical downscaling, global model output is used as boundary conditions for a high-resolution regional model. To reduce scale-change problems, multiple regional model nests are often used as shown here. Data consists of averages over a particular January from the case study described below. Fig. 1: Topography (white contours, in meters) and Mar 1st snow water equivalent (colors, in mm) from observations (NOHRSC) and from a GCM (1°x1.25° Finite Volume CCSM3.0). Goal: Evaluate the usefulness of dynamical downscaling as a tool for predicting future water supply in California (CA). A Case Study • Dynamical downscaling greatly improves the spatial distribution of modeled precipitation, but substantially overestimates precipitation amounts. We performed a 40 yr downscaling experiment using: Average over CA Mountain Region Average over CA Coastal Region Fig. 4: Cumulative distribution functions for 12 km WRF (“resolved” omits convective precipitation), CCSM, and two different observational datasets. WRF total WRF resolved CCSM obs (UW) obs (NOAA) Frequency (%) 0 Observations 12 km WRF CCSM 44 42 40 38 36 34 32 7.6 6.8 6.0 5.2 4.4 3.6 2.8 2.0 1.2 0.4 Daily precipitation magnitude (mm/day) Daily precipitation magnitude (mm/day) • Results: • Downscaling improves the spatial distribution of precipitation, but causes overpredictionin mountainous regions (Fig. 3). • Other studies also find overprediction of West Coast precipitation. • For regional averages, GCM precipitation was actually more accurate (Fig. 4). • Bias results from overprediction of strong events (Fig. 4). • This suggests that dynamical downscaling may be inappropriate for studying extremes. Precip (mm day-1) -126 -123 -120 -117 -114 -126 -123 -120 -117 -114 -126 -123 -120 -117 -114 Fig. 3:Annual-average rain-fall from WRF, CCSM, and observations from Hamlet and Lettenmaier (2005). • Is overprediction of CA precipitation a systematic bias? A Model Intercomparison A survey of state-of-the-art dynamical downscaling implementations confirms that they overpredict and add little value over global models at large scales. Model Resolution (Degrees) We averaged 18 yrs of precipitation data from a variety of sources over CA and compared. Sources: Fig. 5: 95% confidence intervals for bias in 1981-1998 November-March CA-average precipitation. NOAA observations are used as "truth“. Bias (mm/day) • Results: Regional Models Reanalysis Observations GCMs Discussion/Conclusions • This study evaluates the ability of dynamical downscaling to predict the effect of global warming on CA’s water supply. We conclude that this method: • improves the spatial distribution of precipitation (solves problem 1 from Section 1). • offers little improvement in the CA average (doesn’t solve problem 2 from Section 1). • This means that: • potential users should think critically about whether downscaling will help them. • predictions of future CA precipitation are uncertain. • Dynamical downscaling is still our chief method for obtaining high-resolution predictions, so solving the wet-bias problem is a worthwhile goal. This study provides guidance: • The problem is consistent between models and is worst for strong events. • A 50 km GCM behaves like the RCMs, suggesting that bias is related to resolution itself. • Higher resolution ≠ increased accuracy – improvement takes more than bigger computers. • These results suggest that extreme event case studies, resolution sensitivity experiments, and improved precipitation parameterization could greatly improve predictions. This work performed under the auspices of the U.S. Department of Energy by Lawrence Livermore National Laboratory under Contract DE-AC52-07NA27344. LLNL-POST-415588