Factorial ANOVA
Factorial ANOVA. 2 or More IVs. Questions (1). What are main effects in ANOVA? What are interactions in ANOVA? How do you know you have an interaction? What does it mean for a design to be completely crossed? Balanced? Orthogonal? Describe each term in a linear model like this one:.


Factorial ANOVA
E N D
Presentation Transcript
Factorial ANOVA 2 or More IVs
Questions (1) • What are main effects in ANOVA? • What are interactions in ANOVA? How do you know you have an interaction? • What does it mean for a design to be completely crossed? Balanced? Orthogonal? • Describe each term in a linear model like this one:
Questions (2) • Correctly interpret ANOVA summary tables. Identify mistakes in such tables. What’s the matter with this one?
Questions (3) • Find correct critical values of F from a table for a given design. • How does post hoc testing for factorial ANOVA differ from post hoc testing in one-way ANOVA? • Describe a concrete example of a two-factor experiment. Why is it interesting and/or important to consider both factors in one experiment?
2-way ANOVA • So far, 1-Way ANOVA, but can have 2 or more IVs. IVs aka Factors. • Example: Study aids for exam • IV 1: workbook or not • IV 2: 1 cup of coffee or not
Main Effects and Interactions • Main effects seen by row and column means; Slopes and breaks. • Interactions seen by lack of parallel lines. • Interactions are a main reason to use multiple IVs
Single Main Effect for B (Coffee only)
Single Main Effect for A (Workbook only)
Two Main Effects; Both A & B Both workbook and coffee
Interaction (1) Interactions take many forms; all show lack of parallel lines. Coffee has no effect without the workbook.
Interaction (2) People with workbook do better without coffee; people without workbook do better with coffee.
Interaction (3) Coffee always helps, but it helps more if you use workbook.
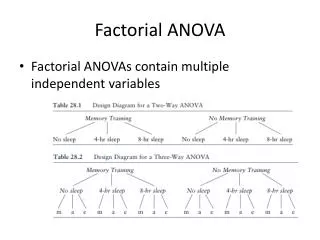
Labeling Factorial Designs • Levels – each IV is referred to by its number of levels, e.g., 2X2, 3X2, 4X3 designs. Two by two factorial ANOVA. • Cell – treatment combination. • Completely Crossed designs –each level of each factor appears at all levels of other factors (vs. nested designs or confounded designs). • Balanced – each cell has same n. • Orthogonal design – random sampling and assignment to balanced cells in completely crossed design.
Review • What are main effects in ANOVA? • What are interactions in ANOVA? How do you know you have an interaction? • What does it mean for a design to be completely crossed? Balanced? Orthogonal?
Population Effects for 2-way Population main effect associated with the treatment Aj (first factor): Population main effect associated with treatment Bk (second factor): The interaction is defined as , so the linear model is: Each person’s score is a deviation from a cell mean (error). The cell means vary for 3 reasons. The interaction is a residual:
Expected Mean Squares (Factor A has J levels; factor B has K levels; there are n people per cell.) E(MS error) = Note how all terms estimate error. E(MS A) = E(MS B) = E(MS Interaction) =
F Tests For orthogonal designs, F tests for the main effects and the interaction are simple. For each, find the F ratio by dividing the MS for the effect of interest by MS error.
Example Factorial Design (1) • Effects of fatigue and alcohol consumption on driving performance. • Fatigue • Rested (8 hrs sleep then awake 4 hrs) • Fatigued (24 hrs no sleep) • Alcohol consumption • None (control) • 2 beers • Blood alcohol .08 % • DV - performance errors on closed driving course rated by driving instructor.
Cells of the Design M=13 M=7 M=2 M=10 M=18 M=10
Factorial Example Results Main Effects? Interactions? Both main effects and the interaction appear significant. Let’s look.
Summary Table Check: Total=Within+Between 728 = 716+12 Interaction = Between – (A+B). Interaction = 716-(512+108) = 96.
Interactions Choose the factor with more levels for X, the horizontal axis. Plot the means. Join the means by lines representing the other factor. The size of the interaction SS is proportional to the lack of parallel lines. If interactions exist, the main effects must be qualified for the interactions. Here, effect of alcohol depends on the amount of rest of the participant.
Review • Correctly interpret ANOVA summary tables. Identify mistakes in such tables. What’s the matter with this one?
Proportions of Variance We can compute R-squared for magnitude of effect, but it’s biased, so the convention is to use omega-squared.
Planned Comparisons (2) The first comparison (B1 v B2) has a value of –6. For any comparison, Note this is the same as SS for B in the ANOVA. Note 7.348 squared is 54, which is our value of F from the ANOVA. (critical t has dfe)
Planned Comparisons (3) We can substitute planned comparisons for tests of main effects; they are equivalent (if you choose the relevant means). We can also do the same for interactions. In general, there are a total of (Cells-1) independent comparisons we can make (6-1 or 5 in our example). Our second test compared no alcohol to all other conditions. This looks to be the largest comparison with these data.
Post Hoc Tests For post hoc tests about levels of a factor, we pool cells. The only real difference for Tukey HSD and Newman –Keuls is accounting for this difference. For interactions, we are back to comparing cells. Don’t test unless F for the effect is significant. For comparing cells in the presence of an interaction:
Post Hoc (2) In our example A has 3 levels, B has 2. Both were significant. No post hoc for B (2 levels). For A, the column means were 2, 10, and 18. Are they different? A: Yes, all are different because the differences are larger than 3.07. But because of the interaction, the interpretation of differences in A or B are tricky.
Post Hoc (3) For the rested folks, is the difference between no alcohol and 2 beers significant for driving errors? The means are 1 and 3. A: They are not significantly different because 2 is less than 5.63. Note: data are fictitious. Do not drink and drive.
Review • Describe each term in a linear model like this one: • How does post hoc testing for factorial ANOVA differ from post hoc testing in one-way ANOVA? • Describe a concrete example of a two-factor experiment. Why is it interesting and/or important to consider both factors in one experiment?
Higher Order Factorials • If you can do ANOVA with 2 factors, you can do it with as many as you like. • For 3 factors, you have one 3-way interaction and three 2-way interactions. • Computations are simple but tedious. • For orthogonal, between-subject designs, all F tests have same denominator. • We generally don’t do designs with more than 3 factors. Complex & expensive.