Download
1 / 17
170 likes | 560 Views
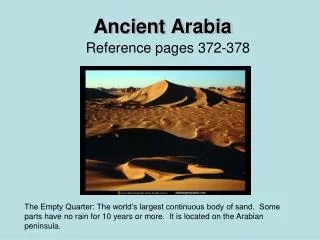
What’s up in the Arabian Sea?. Lesson Plan By: Beth Marass Springvale ME Linda McIntosh Wellesley MA Barbara Simon-Waters Morehead City NC. Summary. In this activity Students will Become familiar with the geography of the Arabian sea

E N D
What’s up in the Arabian Sea? Lesson Plan By: Beth Marass Springvale ME Linda McIntosh Wellesley MA Barbara Simon-Waters Morehead City NC
Summary • In this activity Students will • Become familiar with the geography of the Arabian sea • Learn how to use the Giovanni “real time data” internet tool by looking at the seas’ chlorophyll a, surface temperature and wind direction over an 18 month period. • They will apply this knowledge to gain understanding and appreciation of the local cultural factors
Key Concepts • Understanding the effect of monsoon winds and temperature on upwelling and productivity • Understand the effect of climate change on monsoon patterns. • How these changes affect local biota • How these changes influences the economy of the region • Understanding the geography and culture of the region
Objectives • Observe and identify • Relationships among chlorophyll, SST, SSH and wind direction. • Identify the political and geophysical boundaries surrounding the Arabian Sea on a world map • Record • Construct graphs using recent data from Giovanni • Demonstrate • An understanding of the socio-economic dynamics of the region • An ability to use Giovanni to generate and analyze real-time data • An understanding of the culture and economy of those countries • Interpret • Graphs and images with the help of guiding questions • Communicate results by • Sharing information and working in small groups • Drawing conclusions using their findings to propose local solutions to the biological and socio-economic to response in the Arabian Sea due to climate change.
Materials and Data • Computers with internet access • World Map • Student activity sheets • #1 Map of Arabian Sea and surrounding countries • #2 Background information on local climate changes followed by guiding questions for collecting information on assigned countries. • #3 Wind data observations and directions for Giovanni line graph generation • #4 Sea surface temperature and Chlorophyll a concentrations
Procedure 1. Student Activity Worksheet #1 to each student and ask them to identify the countries, bodies of water, key geographic features using classroom resources, internet, or library materials. 2. As a group, review their findings and divide the students in groups of countries (6 groups representing Somalia, India, Pakistan, Yemen, Oman and Iran) 3. Students will use library materials, internet or classroom resources to collect information about their assigned country (Student Activity Worksheet # 2) 4. Teacher will demonstrate the use of the Giovanni data tool to the class; and show current monsoon conditions in the area by going to Monsoon On Line at http://www.tropmet.res.in/~kolli/MOL/Monsoon/frameindex.html 5 Teacher will show animation of annual wind data to the class (link to wind in Arabian Sea animation from J. Goes). Students will observe the activity of the wind and make key observations. They will add their observations to Activity Worksheet #3. 6. In their country groups, using Student Activity Sheet 3, students will collect information from Giovanni and create line graphs and images and print out graphs. 7 Still in their groups, students will observe, discuss and determine from their line graphs which months to access for max/min SST and chlorophyll concentrations. Generate SST and chlorophyll images for those months. 8. Groups will analyze their images and examine the relationship among SST, chlorophyll concentration, wind direction and climate using guiding questions from Student Activity Sheet # 4. 9. Groups will discuss results (timing, extent and impact of SW and NE monsoons) and propose possible responses and solutions to the environmental concerns (e.g. fish mortality, nutrient run-off)for their countries and the Arabian Sea in general, and check their conclusions with the teacher. 10 Each group will present its findings and recommendations, symposium style, to their classmates, who will compare their issues, conclusions and recommendations with their own.
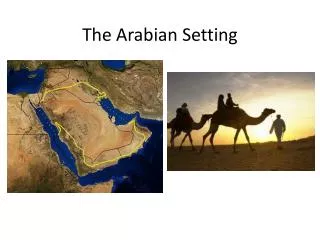
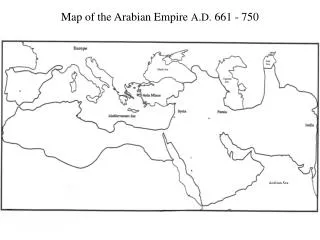
Activity Sheet #1 Background Over the last decade the climate in the Arabian Sea region has changed dramatically. The area has seen significant changes in the Summer Monsoons. The surrounding countries have seen major flooding as well as yearly fish kills due to the loss of oxygen in parts of the sea. Using real time data, you will learn about the physical changes that occur during the year in the Arabian Sea. You will look at Sea surface temperature (SST), wind direction and chlorophyll a concentration. Before we do that, let’s learn more about the area. Students will label a blank map and be assigned a specific country
Activity Sheet #2 In your groups answer the following questions: • What is the population and population density? • What are the major religions? • What is the average family income? • What is their major food source? • List 3 “Fun facts” that you learned about your country as you researched, include at least one that describes how their lives in your country have changed in the last 10 years.
Before Activity sheet #3The teacher will give a presentation on how to use the Giovanni system • Go to http://reason.gsfc.nasa.gov/Giovanni/ • Click onthe second one down • OBPG SeaWiFS Monthly Global 9-km Products JAVA Version • Use Latitudes 30.0 oN to 10.0 o S. Use Longitudes of 40.0 oE to 80.0 oE. 4. For a chlorophyll a image select the followingParameters: chlorophyll a concentration Data Type: parameters Plot Type: Time Series, Area-averaged Begin Year: 2006 Begin Month: January End Year: 2007 End Month: June
Activity Sheet #3 ARABIAN SEA While watching the movie-answer the following questions • What changes do you observe in the wind direction throughout the year and in what months do these changes occur? • 2. Watch the animation again and carefully observe the coastlines of Somalia and India. What inference(s) can you make as to what may be happening in these locations during certain times of the year?
Activity sheet #3 ContThey will plot out both the chlorophyll and sea surface graph over the last 18 months and answer the following questions • What month indicates a high Chlorophyll a concentration?________________________ • What month indicates a low Chlorophyll a concentration?________________________ • What month indicates a high Sea Surface Temperature?_________________________ • What month indicates a low Sea Surface Temperature?__________________________ • Explain possible reasons why the months for these two parameters do not coincide.
Activity sheet #4 Based on their observation of the line graph-students will return to Giovanni and print out the high and low months of Chlorophyll a and SST. In their groups they will answer the following questions: • During what month is the peak of the WET monsoon season? • What evidence do you have from the wind animation? • During what month is the peak of the DRY monsoon season? • What evidence to you have from the wind animation? • Suggest a possible reason for the LOW Sea Surface Temperatures off the coast of Somalia. • What evidence do you have to support your reason? • Does this affect the chlorophyll a concentration? Explain. From all your observations, draw conclusions to what is occurring in the Arabian Sea over a year. Be sure to include wind evidence, sea surface temperatures, and chlorophyll a observations. What effect would this have on the fish populations in the Arabian Sea? Using your observations, offer an explanation as to why fish kills have occurred in the past decade off the coast of Oman Propose solutions that have resulted in these fish kills.
Assessment • Performance • Groups will make oral presentations of their findings • Complete the Student Activity Worksheets • Follow-up writing assignment to be determined by the individual teacher* • Product • Students will make group presentations, by country, to report on their findings; they will • explain their observations of the interactions of SST and wind direction on locations and concentrations chlorophyll levels • describe the timing and extent of the NE and SW monsoons on the Arabian Sea and relate it to primary productivity levels • Explain the impact of the monsoon on their country’s climate and population • Propose possible solutions to the physical and biological changes in the Arabian Sea that impact their geo-political regions (e.g. fishing practices, fertilizer run-off) • Student Activity Worksheets will be evaluated for content accuracy and depth.
Additional Resources Background information: The 1997Asian Summer Monsoon http://www.tropmet.res.in/~kolli/MOL/Monsoon/frameindex.html What is a Monsoon (article) http://snrs.unl.edu/amet351/ogren/monsoons.html Link to real-time data on monsoons in Arabian Sea http://www.tropmet.res.in/~kolli/MOL/
Extension: Take the real time data for SSH and place it on Google Earth
How do you do this? • 1. Generating Near Real-Time Altimetry data from CCSA and importing the data via a .kml file into GoogleEarth. This will show you SSH (height of water, cold and warm) in the Arabian Sea. • a. Go to: Colorado Center for Astrodynamics Research (CCAR) • http://argo.colorado.edu/~realtime/gsfc_global-real-time_ssh/ • Enter Date of interest • Longitude (40, 80) and latitude (0, 30) • Bathymetry: 5 • Output options: Google Earth .kml • NOTE: If you do not see this option, Google “CCAR” and enter via Google . The “Google Earth .kml” option will appear • Other options are all default • b. Press “submit” • a TOPEX picture will be generated as you will be asked to save as a .kml and then open. Save image (to desktop or other location). • 2. Open Google Earth (or it may open automatically as you open the saved file). From Google Earth open the saved file and go to the region .
Teacher Resources • All of the graphs and images required for this activity are in pdf form below so that if internet resources are not available the teacher can print the resources for the students and complete the activity (pdfs of the visuals listed in procedure above) • http://encarta.msn.com/map_701510188/Arabian_Sea.html map geopolitical map of Arabian Sea 3. Giovanni:http://giovanni.gsfc.nasa.gov/ 4. http://www.whoi.edu/oceanus/viewArticle.do?id=2370&archives=true Monsoon Winds and Carbon Cycles in the Arabian Sea 5.http://usjgofs.whoi.edu/arabian.html • Arabian Sea Process Study ,Sharon SmithRosenstiel School of Marine and Atmospheric Science