Download
1 / 6
60 likes | 252 Views
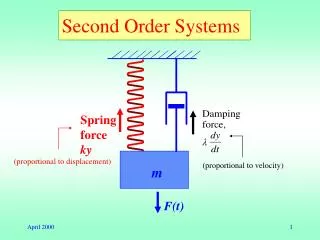
System identification for second order overdamped systems. Method of % Incomplete Response. Second Order Overdamped Response. Consider a second order overdamped system where:. For a unit step input:. And we can readily find a,b,c to be:. Second Order Overdamped Response Solution.

E N D
System identification for second order overdamped systems Method of % Incomplete Response BAE 5413
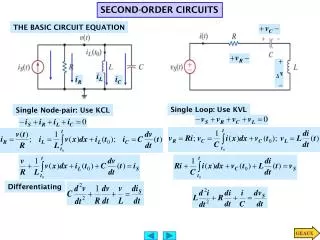
Second Order Overdamped Response Consider a second order overdamped system where: For a unit step input: And we can readily find a,b,c to be: BAE 5413
Second Order Overdamped Response Solution And inverting: For a step of A BAE 5413
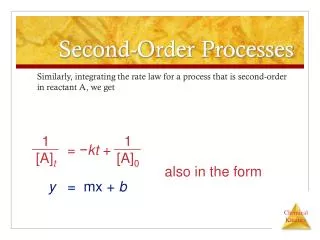
Calculation of %Incomplete Assuming one time constant is much larger than the other, that is t1>> t2 , for large time: This may be written as: This is in the form of: A classic linear form. The slope m=-1/t1 can be determined by plotting on simi-log paper and using the slope for large time. BAE 5413
Procedure for %incomplete response Use a step of magnitude A to excite the system. Plot PIR on a log scale vs. time on a linear scale. Use large times to plot a linear curve of constant slope. This curve is the response for the t1 term. BAE 5413
Procedure for %incomplete response Plot the difference between the first linear curve and the actual response. This difference is the response for the t2 term. Plot a linear curve for this difference. For both linear curves, take each intercept at t=0 as 100% response. Determine the time at 100% -0.368*100% response (this is the 63.2% response point). These times will be t1, and t2 BAE 5413