Download
1 / 6
60 likes | 166 Views
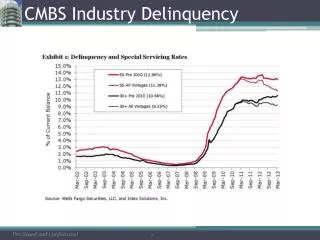
In 2012, LNR's "named special servicing" portfolio experienced significant declines, with a 24% decrease in balance and a 20% decrease in count, lowering from $176.1 billion at the end of 2011 to $133.6 billion. Additionally, LNR’s SS/REO inventory decreased by 34% in balance and 23% in count. The year saw an increased focus on REO properties, with a total of 458 by year-end. Transfers into special servicing totaled $1.85 billion, while resolutions achieved $3.0 billion, reflecting the shifting dynamics in real estate owned and distressed loans.

E N D
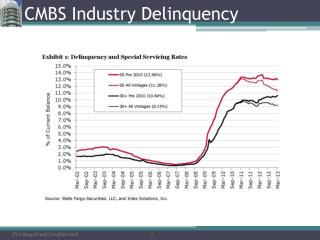
Monthly SS Inventory Year over year, LNR’s “named SS” portfolio has seen a 24% decrease by balance and a 20% decrease by count; $133.6 billion at YE 2012 from $176.1 billion at YE 2011 Year over year, LNR’s current SS/REO inventory has seen a 34% decrease by balance and a 23% decrease by count; $20.0 billion at YE 2012 versus $27.0 billion at YE 2011
Transfer In & Out of Special Servicing • During 4Q 2012: • Transfers in totaled $1.85 billion, comprised of 200 loans • Resolutions totaled $3.0 billion, consisting of 246 loans, which is lower than the 2012 quarterly average of $3.8 billion
Shift to REO • In 2012, LNR’s portfolio shifted towards an increased amount of REO properties – from 339 REO Properties as of 12/31/11 to 458 REO properties as of 12/31/12 • There were 188 REO loans sold in 2011 with a gross sales price of $1.21Bn. In 2012, there were 213 REO loans sold with a gross sales price of $1.62Bn • Reasons for shift include: • Foreclosures commenced in 2010/11 in slow foreclosure states are now resolving • Selling less non-performing loans as LNR has achieved a better execution through an REO sale