Categorical Weather Verification Measures in Meteorology
Understand the categorical verification of weather variables, such as temperature, precipitation, and warnings, using various measures like bias, POD, FAR, as well as the Heidke Skill Score for forecast quality assessment.

Categorical Weather Verification Measures in Meteorology
E N D
Presentation Transcript
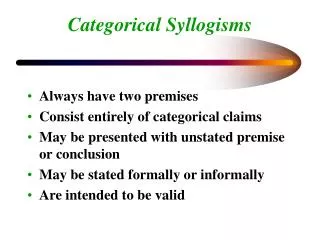
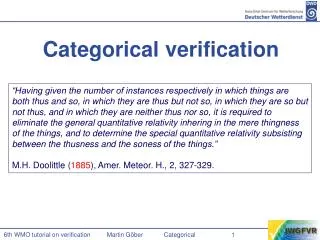
Categorical verification “Having given the number of instances respectively in which things are both thus and so, in which they are thus but not so, in which they are so but not thus, and in which they are neither thus nor so, it is required to eliminate the general quantitative relativity inhering in the mere thingness of the things, and to determine the special quantitative relativity subsisting between the thusness and the soness of the things.” M.H. Doolittle (1885), Amer. Meteor. H., 2, 327-329.
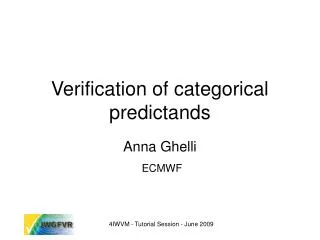
Verificationofcategorical variables Martin Göber Deutscher Wetterdienst (DWD) Hans-Ertel-CentreforWeather Research (HErZ) Acknowledgements: Thanksto Ian Jolliffe!
2 categories: frost (T<= 0 °C), nofrost (T > 0°C) observation o hit false alarm forecast f correct no miss Joint frequencydistribution, roadsurfacetemperature, winter 2011
Contingencytables Binary categories: rain YES/NO, Ceiling < 200ft, gusts >25kt, warning, guilty, ill Contingencytable = „tableofpossibleoutcomes“ „tableofconfusion“ Joint probability p(f,o) p(o ) = „base rate“ = climatology
Categoricalmeasures • Bias, better: frequency bias • = number of YES forecasts / number of YES observed • = (a+b) / (a+c) • range: 0 - ∞ • perfect: 1 • >1 “overforecasting” • <1 “underforecasting” • tells us nothing about the co-occurrence of forecasts and observations ! • a measure, for which we often have a relatively simple physical idea about the error sources
Categoricalmeasures • POD= Probability of Detection • = “hit rate” – ambiguous, better not ! • = “Sensitivity” in medicine • = # hits/ # YES observations • = a / (a+c) • range: 0 … 1 • perfect: 1 • one side perspective – penalises only missed events
Categoricalmeasures • FAR= false alarm ratio • = # false alarms / # YES forecasts • = b / (a+b) • range: 0…1 • perfect: 0 • one sided perspective – penalises only false alarms
Categoricalmeasures • F= false alarm rate • = POFD (Probability Of False Detection) • = # false alarmes/ # NOT observed • = b / (b+d) • = its complement 1-F is called “specificity” in medicine • range: 0…1 • perfect: 0 • one sided perspective – penalises false alarms • often very small number, BUT: absolute value not important , but relative value • matches up with POD • always check definition of F and FAR, they are not uniformly defined in the literature!!!
Categoricalmeasures Weatherwarnings: storm Winter 2004 F A R P O D
Categoricalmeasures „ POD =perspectiveof a tabloid“ „Something happened, was there a warning?“ 100time intervals P(E)=5% 5 events 95 nothinghappened POD=88% F=10% 4 + 0,6- 10 + 85-
Categoricalmeasures „ FAR = perspectiveofemergencymanagement“ „There was a warning, was itnecessary? “ 100time intervals P(W)=14% 14 warnings 86 non warned FAR=70% CR=99% 4 + 10- 1 + 85- Frequencybias= p(f) / p(o) = 3
Categoricalmeasures: frequencybias http://tinyurl.com/verif-training
cost / loss- ratio Total expense G = L * #misses + C * #forecast events Forecast quality and user dependend minimisation problem 15
Categoricalmeasures De-icingserviceat Frankfurt airport
Categoricalmeasures • What to do, if cost/loss ratio is not known ? • Different strategy for models: • Model is “neutral”, i.e. it knows only one “boss “ – the physics • has to fulfil conservation laws must be without bias • b ≈ c, # false alarms ≈ # missed events • diverse weightings exist of false alarms against missed events
Categoricalmeasures What about “Percent correct forecasts” ? • PC = percent correct • = (a+d) / (a+b+c+d) • = (a+d) / N • range: 0 ... 1 • perfect 1 • often used in the media
First issue Historyofverificationin meteorology USA: Finley, J.P. (1884): Tornado predictions. American Meteorological Journal,1, 85-88. Germany: Köppen, W. (1884): Eine rationelle Methode zur Überprüfung der Wetterprognosen. Meteorologische Zeitschrift, 1, 39-41.
5IVMW - Tutorial Session - December 2011 Verification history FINLEY (rounded) PC=(30+2680)/2800= 96.8% H = 30/50 = 60% FAR = 70/100 = 70% B = 100/50 = 2 NEVER ! PC=(2750+0)/2800= 98.2% H = 0 = 0% FAR = 0 = 0% B = 0/50 = 0
Total nonsense for “rare” (non-symmetrical) events, i.e. almost always in meteorology Categoricalmeasures What about “Percent correct forecasts” ? PC = percent correct = (a+d) / (a+b+c+d) = (a+d) / N perfect 1
Categoricalmeasures Better: HeidkeSkill Score HSS (1926) Percent correct, corrected by random correct forecasts • HSS = Heidke Skill Score • = (PC-R) / (N-R) general skill score definition • = (a+d-R) / (a+b+c+d-R) • = (a+d-R) / (N-R) • with R = 1/N ( (a+b)*(a+c) + (c+d)*(b+d) ) • R = (correct YES)random + (correct NO) random • range: -1 ...+1 • perfect 1 • also defined for multi-categorical forecasts !
Categoricalmeasures • Andthenthereare: • ThreatScore TS = criticalsuccessindex CSI • EquitableThreat Score ETS = Gilbert Skillscore GSS • True Skill Score TSS = Hanssen-Kuippers Score HKS = Peirce SkillScore PSS • Odds Ratio OR, Odds Ratio Skill Score ORSS, Odds Ratio BenefitORB • … • see also http://www.cawcr.gov.au/projects/verification/
Summary scores Left panel: Contingency table for five months of categorical warnings against gale-force winds (wind speed > 14m/s) Right panel: Tornado verification statistics B = (a+b)/()a+c) _0.65__ _2.00_ PC = (a+d)/n _0.91__ _0.97_ POD = a/(a+c) _0.58__ _0.60_ FAR = b/(a+b) _0.12__ _0.70_ PAG = a/(a+b) _0.88__ _0.30_ F = b/(b+d) _0.02__ _0.03_ KSS = POD-F _0.56__ _0.57_ TS = a/(a+b+c) _0.54__ _0.25_ ETS = (a-a)/(a+b+c-a) _0.48__ _0.24_ HSS = 2(ad-bc)/[(a+c)(c+d)+(a+b)(b+d)] _0.65__ _0.39_ OR = ad/bc _83.86_ _57.43_ ORSS = (OR-1)/(OR+1) _0.98__ _0.97_ GALE TORNADO
Example 4: answer Correct. Rain occurs with a frequency of only about 20% (74/346) at this station True. The frequency bias is 1.31, greater than 1, meaning over forecasting Correct. It could be seen that the over forecasting is accompanied by high false alarm ratio, but the false alarm rate depends on the observation frequencies, and it is low because the climate is relatively dry Probably true . The PC gives credits to all Those “easy” correct forecasts of the non-occurrence. Such forecasts are easy when the non-occurrence is common The POD is high most likely because the Forecaster has chosen to forecast the occurrence of the event too often, and Has increased the false alarms Yes, both the KSS and HSS are well within The positive range. Remember, the standard For the HSS is a chance forecast, which is Easy to beat.
Example 4: answer Correct. Rain occurs with a frequency of only about 20% (74/346) at this station True. The frequency bias is 1.31, greater than 1, meaning over forecasting Correct. It could be seen that the over forecasting is accompanied by high false alarm ratio, but the false alarm rate depends on the observation frequencies, and it is low because the climate is relatively dry Probably true . The PC gives credits to all Those “easy” correct forecasts of the non-occurrence. Such forecasts are easy when the non-occurrence is common The POD is high most likely because the Forecaster has chosen to forecast the occurrence of the event too often, and Has increased the false alarms Yes, both the KSS and HSS are well within The positive range. Remember, the standard For the HSS is a chance forecast, which is Easy to beat.
Multi-category events • The 2x2 tables can be extended to several mutually exhaustive categories • Rain type: rain/snow/freezing rain • Wind warning: strong gale/gale/no gale • Cloud cover: 1-3 okta/4-7 okta/ >7 okta • Only PC (Proportion Correct) can be directly generalised • Other verification measures need to be converted into a series of 2x2 tables Generalised version of HSS and KSS - measure ofimprovement over random forecast
Total distribution =CAPE, Omega, MOS, EPS, CIA-TI, finger prints, ....
Ability to discriminate between occurrence and non-occurence
False alarms POD=70% FAR=15% Bias=80% misses threshold Ability to discriminate between occurrence and non-occurence
False alarms POD=90% FAR=40% Bias=150% misses threshold Ability to discriminate between occurrence and non-occurence
Summary • Verification is a high dimensional problem can be boiled down to a lower dimensional under certain assumptions or interests • Categorical forecast verification is confusing, because categorical forecasts are a mixture of meteorological information and user dependent decisions