Download
1 / 36
360 likes | 498 Views
This tutorial session, led by Anna Ghelli from ECMWF in June 2009, explores the fundamentals of verifying categorical forecasts. It covers the definition, basic concepts, and scoring methods used to evaluate these forecasts. The session includes practical exercises and concludes with key insights on improving forecasting accuracy. Topics discussed include contingency tables, joint and marginal probabilities, various scoring metrics, and challenges in multi-category event verification. Gain a solid understanding of how to assess categorical forecasts effectively.

E N D
Verification of categorical predictands Anna Ghelli ECMWF 4IWVM - Tutorial Session - June 2009
Outline • What is a categorical forecast? • Basic concepts • Basic scores • Exercises • Conclusions YES/NO 4IWVM - Tutorial Session - June 2009
Basic concepts • Categorical: only one of a set of possible events will occur • Categorical forecast does not contain expression of uncertainty • There is typically a one-to-one correspondence between the forecast values and the observed values. • The simplest possible situation is a 2x2 case or verification of a categorical yes/no forecast: 2 possible forecasts (yes/no) and 2 possible outcomes (event observed/event not observed) 4IWVM - Tutorial Session - June 2009
Contingency tables 4IWVM - Tutorial Session - June 2009
How do we build a contingency table? d a b c 4IWVM - Tutorial Session - June 2009
Contingency tables Marginal probability: sum of column or row divided by the total sample size For example the marginal probability of a yes forecast is: px=Pr(X=1) = 100/2800 = 0.03 Sum of rows Total sample size 4IWVM - Tutorial Session - June 2009
Contingency tables Joint probability: represents the intersection of two events in a cross-tabulation table. For example the joint probability of a yes forecast and a yes observed: Px,y=Pr(X=1,Y=1) = 30/2800 = 0.01 4IWVM - Tutorial Session - June 2009
Range: 0 to Perfect score = 1 Basic measures/scores • Frequency Bias Index (Bias) • FBI > 1 over forecasting • FBI < 1 under forecasting • Proportion Correct • simple and intuitive • yes and no forecasts are rewarded equally • can be maximised by forecasting the most likely event all the time Range: 0 to 1 Perfect score = 1 4IWVM - Tutorial Session - June 2009
Basic measures/scores • Hit Rate, Probability Of Detection, Prefigurance • sensitive to misses events and hits, only • can be improved by over forecasting • complement score Miss Rate MS=1-H=c/(a+c) • False Alarm Ratio • function of false alarms and hits only • can be improved by under forecasting Range: 0 to 1 Perfect score = 1 Range: 0 to 1 Perfect score = 0 4IWVM - Tutorial Session - June 2009
Basic measures/scores • Post agreement • Complement FAR -> PAG=1-FAR • not widely used • sensitive to false alarms and hits Range: 0 to 1 Perfect score = 1 • False Alarm Rate, Probability of False Detection • sensitive to false alarms and correct negative • can be improved by under forecasting • generally used with H (POD) to produce ROC score for probability forecasts (see later on in the week) Range: 0 to 1 Perfect score = 0 4IWVM - Tutorial Session - June 2009
Basic measures/scores • Threat Score, Critical Success Index • takes into account: hits, misses and false alarms • correct negative forecast not considered • sensitive to climatological frequency of event Range: 0 to 1 Perfect score = 1 No skill level = 0 • Equitable Threat Score, Gilbert Skill Score (GSS) • it is the TS which includes the hits due to the random forecast Range: -1/3 to 1 Perfect score = 1 No skill level = 0 4IWVM - Tutorial Session - June 2009
Range: - to 1 Perfect score = 1 No skill level = 0 Basic measures/scores • Hanssen & Kuipper’s Skill Score, True Skill Statistic (TSS), Pierce’s Skill Score • popular combination of H and F • Measures the ability to separate yes (H)and no (F) cases • For rare events d is very large -> F small and KSS (TSS) close to POD (H) • Related to ROC (Relative Operating Characteristic) Range: -1 to 1 Perfect score = 1 No skill level = 0 • Heidke Skill Score • Measures fractional improvements over random chance • Usually used to score multi-category events 4IWVM - Tutorial Session - June 2009
Range: 0 to Perfect score = No skill level = 1 Basic measures/scores • Odds Ratio • measures the forecast probability(odds) to score a hit (H) compared to giving a false alarm (F) • independent of biases • unbound • Odds Ratio Skill Score • produces typically very high absolute skill values (because of its definition) • Not widely used in meteorology Range: -1 to 1 Perfect score = 1 4IWVM - Tutorial Session - June 2009
Verification history PC=(30+2680)/2800= 96.8% H = 30/50 = 60% FAR = 70/100 = 70% B = 100/50 = 2 PC=(2750+0)/2800= 98.2% H = 0 = 0% FAR = 0 = 0% B = 0/50 = 0 4IWVM - Tutorial Session - June 2009
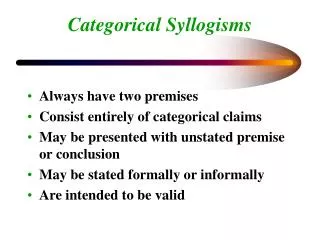
Multi-category events • The 2x2 tables can be extended to several mutually exhaustive categories • Rain type: rain/snow/freezing rain • Wind warning: strong gale/gale/no gale • Cloud cover: 1-3 okta/4-7 okta/ >7 okta • Only PC (Proportion Correct) can be directly generalised • Other verification measures need to be converted into a series of 2x2 tables Generalised version of HSS and KSS - measure ofimprovement over random forecast X fi 4IWVM - Tutorial Session - June 2009
Multi-category events Calculate: PC = ? KSS = ? HSS = ? results: PC = 0.61 KSS = 0.41 HSS = 0.37 4IWVM - Tutorial Session - June 2009
Summary scores Left panel: Contingency table for five months of categorical warnings against gale-force winds (wind speed > 14m/s) Right panel: Tornado verification statistics B = (a+b)/(a+c) ______ ______ PC = (a+d)/n ______ ______ POD = a/(a+c) ______ ______ FAR = b/(a+b) ______ ______ PAG = a/(a+b) ______ ______ F = b/(b+d) ______ ______ KSS = POD-F ______ ______ TS = a/(a+b+c) ______ ______ ETS = (a-ar)/(a+b+c-ar) ______ ______ HSS = 2(ad-bc)/[(a+c)(c+d)+(a+b)(b+d)] ______ ______ OR = ad/bc ______ ______ ORSS = (OR-1)/(OR+1) ______ ______ GALE TORNADO 4IWVM - Tutorial Session - June 2009
Summary scores Left panel: Contingency table for five months of categorical warnings against gale-force winds (wind speed > 14m/s) Right panel: Tornado verification statistics B = (a+b)/()a+c) _0.65__ _2.00_ PC = (a+d)/n _0.91__ _0.97_ POD = a/(a+c) _0.58__ _0.60_ FAR = b/(a+b) _0.12__ _0.70_ PAG = a/(a+b) _0.88__ _0.30_ F = b/(b+d) _0.02__ _0.03_ KSS = POD-F _0.56__ _0.57_ TS = a/(a+b+c) _0.54__ _0.25_ ETS = (a-a)/(a+b+c-a) _0.48__ _0.24_ HSS = 2(ad-bc)/[(a+c)(c+d)+(a+b)(b+d)] _0.65__ _0.39_ OR = ad/bc _83.86_ _57.43_ ORSS = (OR-1)/(OR+1) _0.98__ _0.97_ GALE TORNADO 4IWVM - Tutorial Session - June 2009
Example 1 http://tinyurl.com/verif-training 4IWVM - Tutorial Session - June 2009
Example 1 -- Answer 4IWVM - Tutorial Session - June 2009
Example 2 4IWVM - Tutorial Session - June 2009
Example 2 -- answer 4IWVM - Tutorial Session - June 2009
Example 3 4IWVM - Tutorial Session - June 2009
Example 3 -- answer 4IWVM - Tutorial Session - June 2009
Example 4 4IWVM - Tutorial Session - June 2009
Example 4 -- answer 4IWVM - Tutorial Session - June 2009
Example 5 4IWVM - Tutorial Session - June 2009
Example 5 -- answer 4IWVM - Tutorial Session - June 2009
Example 6 4IWVM - Tutorial Session - June 2009
Example 6 -- answer 4IWVM - Tutorial Session - June 2009
Example 7 4IWVM - Tutorial Session - June 2009
Example 7 -- answer 4IWVM - Tutorial Session - June 2009
Example 8 4IWVM - Tutorial Session - June 2009
Example 8 -- answer Correct. Rain occurs with a frequency of only about 20% (74/346) at this station True. The frequency bias is 1.31, greater than 1, meaning over forecasting Correct. It could be seen that the over forecasting is accompanied by high false alarm ratio, but the false alarm rate depends on the observation frequencies, and it is low because the climate is relatively dry Probably true . The PC gives credits to all Those “easy” correct forecasts of the non-occurrence. Such forecasts are easy when the non-occurrence is common The POD is high most likely because the Forecaster has chosen to forecast the occurrence of the event too often, and Has increased the false alarms Yes, both the KSS and HSS are well within The positive range. Remember, the standard For the HSS is a chance forecast, which is Easy to beat. 4IWVM - Tutorial Session - June 2009
Conclusions • Definition of categorical forecast • How to build a contingency table and what are the marginal and joint probabilities • Basic scores for simple 2x2 tables • Extension to multi-category events • Practical exercises 4IWVM - Tutorial Session - June 2009
references • Jolliffe and Stehenson (2003): Forecast verification: A practitioner’s guide, Wiley & sons • Nurmi (2003): Recommendations on the verification of local weather forecasts. ECMWF Techical Memorandum, no. 430 • Wilks (2005): Statistical methods in the atmospheric sciences, ch. 7. Academic Press • JWGFVR (2009): Recommendation on verification of precipitation forecasts. WMO/TD report, no.1485 WWRP 2009-1 • http://tinyurl.com/verif-training • http://www.bom.gov.au/bmrc/wefor/staff/eee/verif/verif_web_page.html 4IWVM - Tutorial Session - June 2009