Download
1 / 27
270 likes | 353 Views
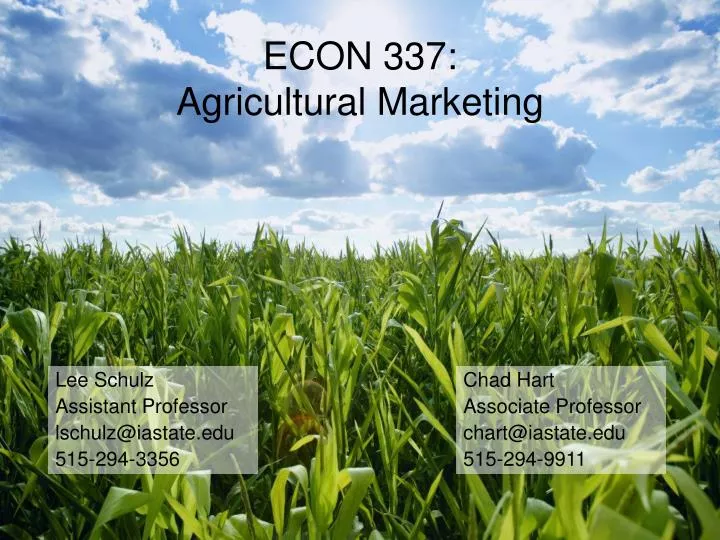
ECON 337: Agricultural Marketing. Lee Schulz Assistant Professor lschulz@iastate.edu 515-294-3356. Chad Hart Associate Professor chart@iastate.edu 515-294-9911. Market Participants.

E N D
ECON 337: Agricultural Marketing Lee Schulz Assistant Professor lschulz@iastate.edu 515-294-3356 Chad Hart Associate Professor chart@iastate.edu 515-294-9911
Market Participants • Hedgers are willing to make or take physical delivery because they are producers or users of the commodity • Use futures to protect against a price movement • Cash and futures prices are highly correlated • Hold counterbalancing positions in the two markets to manage the risk of price movement
Hedgers • Farmers, livestock producers • Merchandisers, elevators • Food processors, feed manufacturers • Exporters • Importers What happens if futures market is restricted to only hedgers?
Market Participants • Speculators have no use for the physical commodity • They buy or sell in an attempt to profit from price movements • Add liquidity to the market • May be part of the general public, professional traders or investment managers • Short-term – “day traders” • Long-term – buy or sell and hold
Market Participants • Brokers exercise trade for traders and are paid a flat fee called a commission • Futures are a “zero sum game” • Losers pay winners • Brokers always get paid commission
Hedging • Holding equal and opposite positions in the cash and futures markets • The substitution of a futures contract for a later cash-market transaction • Who can hedge? • Farmers, merchandisers, elevators, processors, exporter/importers
Cash vs. Futures Prices Iowa Corn in 2013
Short Hedgers • Producers with a commodity to sell at some point in the future • Are hurt by a price decline • Sell the futures contract initially • Buy the futures contract (offset) when they sell the physical commodity
Short Hedge Example • A soybean producer will have 25,000 bushels to sell in November • The short hedge is to protect the producer from falling prices between now and November • Since the farmer is producing the soybeans, they are considered long in soybeans
Short Hedge Example • To create an equal and opposite position, the producer would sell 5 November soybean futures contracts • Each contract is for 5,000 bushels • The farmer would short the futures, opposite their long from production • As prices increase (decline), the futures position loses (gains) value
Short Hedge Expected Price • Expected price = Futures prices when I place the hedge + Expected basis at delivery – Broker commission
Short Hedge Example • As of Jan. 21, ($ per bushel) Nov. 2014 soybean futures $11.09 Historical basis for Nov. $-0.30 Rough commission on trade $-0.01 Expected price $10.78 • Come November, the producer is ready to sell soybeans • Prices could be higher or lower • Basis could be narrower or wider than the historical average
Prices Went Up, Hist. Basis • In November, buy back futures at $12.00 per bushel ($ per bushel) Nov. 2014 soybean futures $12.00 Actual basis for Nov. $-0.30 Local cash price $11.70 Net value from futures $-0.92 ($11.09 - $12.00 - $0.01) Net price $10.78
Prices Went Down, Hist. Basis • In November, buy back futures at $10.00 per bushel ($ per bushel) Nov. 2014 soybean futures $10.00 Actual basis for Nov. $-0.30 Local cash price $ 9.70 Net value from futures $ 1.08 ($11.09 - $10.00 - $0.01) Net price $10.78
Short Hedge Graph Hedging Nov. 2014 Soybeans @ $11.09
Prices Went Down, Basis Change • In November, buy back futures at $10.00 per bushel ($ per bushel) Nov. 2014 soybean futures $10.00 Actual basis for Nov. $-0.10 Local cash price $ 9.90 Net value from futures $ 1.08 ($11.09 - $10.00 - $0.01) Net price $10.98 • Basis narrowed, net price improved
Long Hedgers • Processors or feeders that plan to buy a commodity in the future • Are hurt by a price increase • Buy the futures initially • Sellthe futures contract (offset) when they buy the physical commodity
Long Hedge Example • An ethanol plant will buy 50,000 bushels of corn in December • The long hedge is to protect the ethanol plant from rising corn prices between now and December • Since the plant is using the corn, they are considered short in corn
Long Hedge Example • To create an equal and opposite position, the plant manager would buy 10 December corn futures contracts • Each contract is for 5,000 bushels • The plant manager would long the futures, opposite their short from usage • As prices increase (decline), the futures position gains (loses) value
Long Hedge Expected Price • Expected price = Futures prices when I place the hedge + Expected basis at delivery + Broker commission
Long Hedge Example • As of Jan. 21, ($ per bushel) Dec. 2014 corn futures $ 4.47 Historical basis for Dec. $ -0.25 Rough commission on trade $+0.01 Expected local net price $ 4.23 • Come December, the plant manager is ready to buy corn to process into ethanol • Prices could be higher or lower • Basis could be narrower or wider than the historical average
Prices Went Up, Hist. Basis • In December, sell back futures at $5.00 per bushel ($ per bushel) Dec. 2014 corn futures $ 5.00 Actual basis for Dec. $-0.25 Local cash price $ 4.75 Less net value from futures $-0.52 -($5.00 - $4.47 - $0.01) Net cost of corn $ 4.23 • Futures gained in value, reducing net cost of corn to the plant
Prices Went Down, Hist. Basis • In December, sell back futures at $3.00 per bushel ($ per bushel) Dec. 2014 corn futures $ 3.00 Actual basis for Dec. $ -0.25 Local cash price $ 2.75 Less net value from futures $+1.48 -($3.00 - $4.47 - $0.01) Net cost of corn $ 4.23 • Futures lost value, increasing net cost of corn
Long Hedge Graph Hedging Dec. 2014 Corn @ $4.47
Prices Went Down, Basis Change • In December, sell back futures at $3.00 per bushel ($ per bushel) Dec. 2014 corn futures $ 3.00 Actual basis for Dec. $ -0.10 Local cash price $ 2.90 Less net value from futures $+1.48 -($3.00 - $4.47 - $0.01) Net cost of corn $ 4.38 • Basis narrowed, net cost of corn increased
Hedging Results • In a hedge the net price will differ from expected price only by the amount that the actual basis differs from the expected basis. • So basis estimation is critical to successful hedging. • Narrowing basis, good for short hedgers, bad for long hedgers • Widening basis, bad for short hedgers, good for long hedgers
Class web site: http://www.econ.iastate.edu/~chart/Classes/econ337/Spring2014/ Lab in Heady 68!