Gridded warning verification
Basic verification. Match observations and forecastsClearly defined eventsInformation to fill in 2x2 table. 2x2 Table. a = Correct fore. of events, d = Correct non-eventb = False alarm, c = Missed event. Scores. Probability of detection=a/(a c) (POD)Probability of false detection=b/(b d) (POFD)False alarm ratio (rate) = b/(a b) (FAR)Frequency of hits=a/(a b) (FOH=1-FAR)Detection failure ratio=c/(c d) (DFR)F-score=2*POD*(FOH)/(POD FOH)Odds ratio=ad/bcThreat score (CSI)=a/(a b c)=f(POD, FAR).

Gridded warning verification
E N D
Presentation Transcript
1. Gridded warning verification Harold E. Brooks
NOAA/National Severe Storms Laboratory
Norman, Oklahoma
Harold.Brooks@noaa.gov
2. Basic verification Match observations and forecasts
Clearly defined events
Information to fill in 2x2 table
3. 2x2 Table
a = Correct fore. of events, d = Correct non-event
b = False alarm, c = Missed event
4. Scores Probability of detection=a/(a+c) (POD)
Probability of false detection=b/(b+d) (POFD)
False alarm ratio (rate) = b/(a+b) (FAR)
Frequency of hits=a/(a+b) (FOH=1-FAR)
Detection failure ratio=c/(c+d) (DFR)
F-score=2*POD*(FOH)/(POD+FOH)
Odds ratio=ad/bc
Threat score (CSI)=a/(a+b+c)=f(POD, FAR)
5. Skill scores (1) Equitable threat score
ETS=(a-CH)/(a+b+c-CH)
CH=(a+b)(a+c)/n2
Extreme dependency score
EDS=2{log([a+c]/N)/log(a/N)}-1
Doesn�t go to zero as event becomes rare
6. Skill scores (2) Peirce (Hanssen-Kuipers)
(ad-bc)/[(a+c)(b+d)]=POD-POFD
(Correct-CH)/(1-CHclim)
Doolittle (Heidke)
(ad-bc)/[(ad-bc)-(1/2)(b+c)]
(Correct-CH)/(1-CH)
Clayton
(ad-bc)/[(a+b)(c+d)]=FOH-DFR
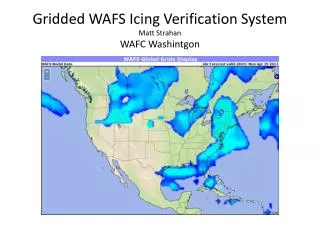
7. Current status Warnings are issued for counties (or parts)
Reports are points
How can we make the 2x2 table?
Correct forecast-either covers the report or report is within county
False alarm-counties without reports
Missed event-report without warning
Correct no event?
8. Quantities Probability of detection
Events within warning areas/total events
False alarm ratio
Forecasts without events/total forecasts
Other quantities can�t be calculated
9. Current approach Calculate POD based on events
Calculate FARatio based on areas
Calculate CSI from POD and FARatio
10. Problems Inconsistent definition, no information on d
Provides little information on performance
11. A vision Consistency between area and event definitions
Consistency with other forecast products
Allow for growth
12. Gridding the events High resolution time/space grid
O(1-5 km, 5-15 minutes)
Grid boxes are either 0 or 1 for each location, time for all weather types
Grid SPC products on the same grid
13. Output Series of 0,1 values (could be probabilities)
Outlooks
Watch status
Warning
Reports
Doswell and Keller (1993) did this for watches on an hourly time scale, MDR block
14. 2x2 table If you can decide what d is, you can make 2x2 tables
General thunder?
Convective outlook?
Some events may not be in table
Massively large
4x4 km, 15 min-~500,000 locations, 35,000 times
15. Issues Traditional scores would be really different
Clean up data collection
Could draw warning on grid, translate to county definitions
Time domain
If warning comes out in middle of time block, what to do? (Block could be smaller or 0 or 1 for this purpose)
19. Advantages Encourages data collection (could be probabilistic events or NCAR/RAP approach)
Allows for baseline comparisons
Are warnings better when watches are in effect?
Stratify by time of day, location, etc.
More informative scores can be derived