Download
1 / 64
640 likes | 737 Views
Explore various options strategies - bullish, bearish, or neutral. Understand Long Stock's profit diagram, Short Stock's risks, and Long Call's investment potential.

E N D
PART – VI Options Strategies & Profit Diagrams
Introduction • Using options, we can create many different strategies. • These can be tailored to suit the individual investor’s risk preferences and price expectations. • The strategies may be bullish, bearish, or neutral.
Introduction (Cont…) • They may be aggressive, defensive, or virtually risk-less. • For every strategy, we will show the cost of setting it up, the payoffs and the profit/loss at expiration, and the breakeven price(s).
Long Stock • We will consider a Long Stock position because it is a very basic position, although it does not entail the use of options. • Let the prevailing stock price be St. • We will denote the stock price at expiration by ST, which is obviously a random variable.
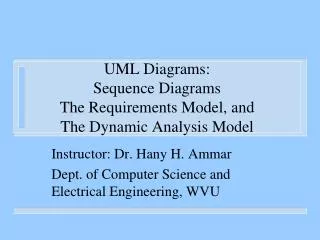
Long Stock (Cont…) • A person who buys the stock at time t and holds it till time T is said to be long in the stock. • The initial investment is St. • The profit diagram may be depicted as follows.
л ST St -St
Long Stock (Cont…) • The X-axis denotes the stock price at expiration, and the Y-axis denotes the profit. • The profit diagram is a 45 line passing through the X-axis at ST = St. • Why is the diagram a 45 line?
Long Stock (Cont…) • For every rupee increase in the terminal stock price, the profit will be Rs 1 more. • And every rupee decrease, it will be Rs 1 less. • If the terminal stock price is equal to the initial stock price, the profit will be zero. • The maximum profit is unlimited, because the terminal stock price has no upper bound.
Long Stock (Cont…) • The maximum possible loss is equal to the price paid at the outset, because the terminal stock price cannot go below zero due to limited liability. • This strategy is appropriate for investors who are bullish about the market, because the investor makes money if the market moves up.
Long Stock (Cont…) • It is an aggressive strategy, because the investor can make substantial losses, if his forecast of the market is wrong.
Numerical Illustration • Assume that you buy a share of Colgate Palmolive for Rs 100. • If the terminal stock price is also equal to Rs 100, then the profit will be zero. • Since there is no upper bound on the terminal stock price, the maximum profit, ST – 100, is unlimited. • The lowest possible value of ST is zero. So the maximum loss is Rs 100.
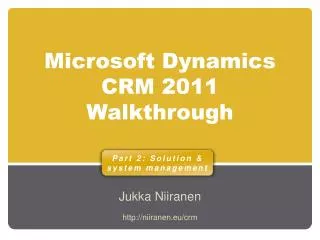
Short Stock • This too is a basic position in the underlying asset. • The strategy entails short selling the stock at the initial price of St, and buying it back later at a price of ST. • The profit diagram can be depicted as follows.
St л ST St
Short Stock (Cont…) • The profit diagram is a line with a slope of -1, passing through the X-axis at ST = St. • Why is the slope of the line –1? • For every rupee increase in the terminal stock price, the profit will be Rs 1 less. • And for every rupee decrease in the terminal price, the profit will be Rs 1 more.
Short Stock (Cont…) • If the price at which the stock is bought back is equal to the price paid at the outset, then the profit will be zero. • The minimum price at which the share can be bought back is zero. • Therefore the maximum possible profit is the initial share price.
Short Stock (Cont…) • The terminal stock price has no upper bound, so consequently the maximum possible loss is unlimited. • The strategy is appropriate for bearish investors, because if the market were to fall, they would benefit. • It is a very aggressive strategy, because losses can be substantial.
Numerical Illustration • Assume that a share of Colgate Palmolive is sold short at Rs 100. • If the price at which the share is bought back subsequently is also Rs 100, then the profit will be zero. • Since the lowest possible price at the time of purchase is zero, the maximum possible profit is Rs 100.
Numerical Illustration (Cont…) • Since the terminal stock price has no upper bound, the maximum possible loss, which is 100 – ST, is unlimited.
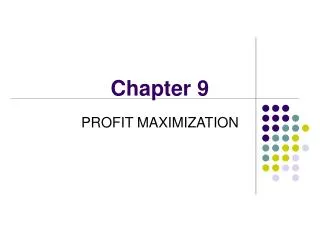
Long Call • A long position in the call means that the investor has bought the call option. • Let the exercise price be X, and the call premium be Ct. • If the terminal stock price is less than the exercise price, the option will expire worthless, and the investor’s loss will be equal to the premium paid at the outset.
Long Call (Cont…) • So for the price range, 0 ST X, the profit is: = -Ct. • As the terminal stock price rises beyond X, the profit will increase rupee for rupee. • Thus for the price range, ST > X: = ST – X - Ct
Long Call (Cont…) • The breakeven price is given by: • ST* = X + Ct • The maximum possible loss is equal to the premium paid for the option. • The maximum profit is unlimited. • The strategy is meant for bullish investors because it makes money when prices rise.
Long Call (Cont…) • It is a defensive strategy, because the maximum possible loss is limited to the premium paid, if the market were to fall. • The profit diagram may be depicted as follows.
л X ST X + Ct -Ct
Numerical Illustration • Assume that you buy a call option with an exercise price of Rs 100, on Colgate Palmolive, for a premium of Rs 8. • If the terminal stock price is less than Rs 100, the option will not be exercised, and the entire premium of Rs 8 will be a loss.
Numerical Illustration (Cont…) • If ST > Rs 100, the profit will increase rupee for rupee. • The breakeven stock price is: • Rs 100 + Rs 8 = Rs 108 • The maximum profit is unlimited.
Writing a Naked Call • Writing a call means selling a call option. • Writing a naked call means selling a call option without owning the underlying stock. • Let us consider a call option with an exercise price of X. • We will denote the corresponding premium by Ct.
Naked Calls (Cont…) • If the stock price at expiration is less than the exercise price, then the other party will not exercise the option, and the writer will get to keep the entire premium. • That is, if 0 ST X, then: = Ct
Naked Calls (Cont…) • As the stock price rises above X, the writer will lose rupee for rupee, because the other party will now exercise. • So while the maximum gain for the writer is limited to the premium paid at the outset, the maximum loss is unlimited because the terminal stock price has no upper limit.
Naked Calls (Cont…) • The position will breakeven when ST = X + Ct. • The strategy is suitable for bearish investors, for they stand to make money if the market were to fall. • It is an aggressive strategy, for while profits are limited, losses are unlimited. • The profit diagram may be depicted as follows.
Ct л X ST X + Ct
Numerical Illustration • Consider a call with an exercise price of Rs 100 on Colgate Palmolive. • Let the premium be Rs 8. • If the terminal stock price is less than or equal to Rs 100, the profit for the writer is Rs 8. • As the terminal stock price rises above Rs 100 the profit will fall rupee for rupee.
Numerical Illustration (Cont…) • The breakeven stock price is: Rs 100 + Rs 8 = Rs 108. • The maximum loss is unlimited.
Long Put • A long position in a put means buying a put option. • If the terminal stock price were to be greater than the exercise price then the put will expire worthless, and the investor will lose the entire premium. • So, if ST X, = -Pt
Long Put (Cont…) • As the terminal stock price declines below X, the profit will increase rupee for rupee. • The breakeven stock price is given by: X – ST – Pt = 0 ST* = X – Pt. • The maximum profit is also X – Pt, because the minimum stock price is zero. • The maximum possible loss is limited to the initial premium paid.
Long Put (Cont…) • This strategy will be preferred by bearish investors. • It is a defensive strategy because the maximum possible loss is limited. • The profit diagram may be depicted as follows.
X - Pt л X - Pt X ST
Numerical Illustration • Consider a put option on Colgate Palmolive with an exercise price of Rs 100. • Let the premium be Rs 6. • If the terminal stock price were to be greater than Rs 100, the investor will let the option expire worthless, and the loss will be Rs 6. • If the stock price dips below Rs 100, the profit will increase rupee for rupee.
Numerical Illustration (Cont…) • The breakeven stock price is: Rs 100 – Rs 6 = Rs 94. • The maximum profit is also Rs 94.
Writing a Put • Writing a put means selling a put option. • When you sell a put, the best thing that can happen is that the option will not be exercised, in which case the profit is equal to the premium received. • So if ST X, = Pt. • As the stock price dips below X, the profit will decline rupee for rupee.
Writing a Put (Cont…) • The breakeven price is: X – Pt. • The maximum loss is also X – Pt, because the lowest possible stock price is zero. • The maximum profit is of course Pt. • The strategy is suitable for bullish investors because it makes money if the market rises.
Writing a Put (Cont…) • It is an aggressive strategy because there can be substantial losses. • The profit diagram may be depicted as shown below:
Pt л X ST X - Pt -(X – Pt)
Numerical Illustration • Assume that an investor writes a put with an exercise price of Rs 100 on Colgate Palmolive. • Let the premium be Rs 6. • If the terminal stock price is greater than Rs 100, then the other party will not exercise, and the profit for the investor is Rs 6.
Numerical Illustration (Cont…) • If the terminal stock price goes below Rs 100, the profit will decline rupee for rupee. • The breakeven stock price is: • Rs 100 – Rs 6 = Rs 94. • The maximum loss is Rs 94.
Writing a Covered Call • When an investor writes a covered call, he writes a call option for every share in his possession. • If we denote the initial share price as St and the terminal share price as ST, then the profit when the share is sold is: ST - St
Covered Call (Cont…) • Profit from the call may be expressed as: Ct – Max[0, ST – X] • The overall profit is: • ST – St + Ct – Max[0, ST – X] • If ST X, = ST – St + Ct • Because in this price range, the call will not be exercised by the other party.
Covered Call (Cont…) • As the stock price goes below X, the profit will decline rupee for rupee. • The maximum loss will occur when ST = 0, and is equal to –St + Ct. • The position will breakeven when: ST = St - Ct
Covered Call (Cont…) • If ST > X, = X – St + Ct • In this price range therefore, the profit is a constant. • This also happens to be the maximum possible profit. • The profit diagram may be depicted as follows.
X – St + Ct л X ST St - Ct -St + Ct
Covered Call (Cont…) • The maximum profit that can be earned is limited because the stock will be called away if ST > X. • The maximum return is called the if-called return because it is the return earned if the call is exercised by the other party, and the stock is called away.