Map Projections
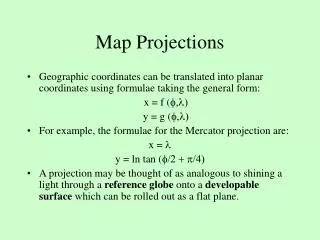
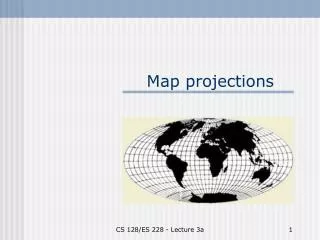
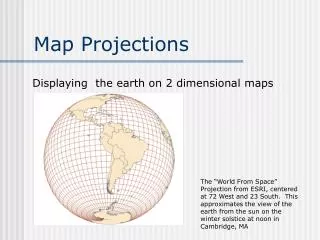
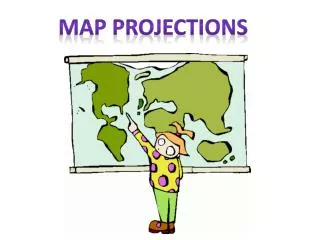
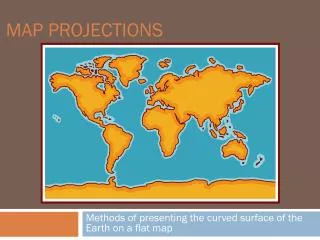
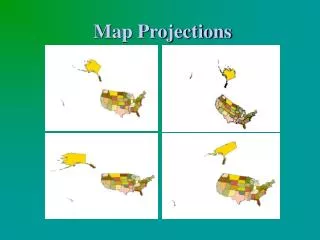
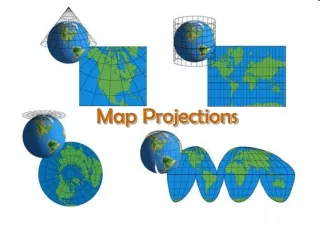
Map Projections. From 3D Globe to 2D Map. As you learned from trying to create your globe, there is no perfect way to take a 3D globe and perfectly turn it into a 2D map. Maps get around the “orange peel problem” by distorting the Earth’s features in one of four ways:

Map Projections
E N D
Presentation Transcript
From 3D Globe to 2D Map • As you learned from trying to create your globe, there is no perfect way to take a 3D globe and perfectly turn it into a 2D map. • Maps get around the “orange peel problem” by distorting the Earth’s features in one of four ways: • Distance – Are locations the same length apart on the map and in real life? • Direction – Is straight up on the map always north? • Shape – Do the outlines of countries look right? • Area – Are areas the same size on the map as they are in real life?
The projections that you need to know! Azimuthal Equidistant, Mercator, Mollweide, Lambert Conic, Robinson, Lambert Conic, Gall-Peters, WinkelTripel, Interrupted GoodeHomolosine
Azimuthal Equidistant Projection • Abū al-Rayhān Muhammad ibn Ahmad al-Bīrūnī one of the greatest scholars of the medieval Islamic era and was well versed in physics, mathematics, astronomy, and natural sciences, and also distinguished himself as a historian, chronologist and linguist. Abūcreated the first known Azimuthal Equidistant Projection sometime around 1000 CE. • Distorts: Area and Shape (but mostly far from the center of the map) • Maintains: Distance and Direction from the center of the map • Strengths: • You can accurately measure distance either from or through the center of the map. • Useful for pilots if the map is centered at their starting place. • Weaknesses: • Crazy distorted the farther out you get. • Distance and direction only measurable at or through the center. Missed Picture Day And Re-Take Day
Check out my sweet hat! I’ve got it going on! Mercator Projection • Since it was created in1569 by Gerardus Mercator, it has been a mainstay of maps of the world • Distorts: Distance, shape, and area • Maintains: Direction • Strengths: • Navigating the oceans • Not much else (unless you count being rectangular) • Weaknesses: • You rarely see Mercator projections showing all the way to the poles because it is so distorted at the poles. • Africa is actually 14x larger than Greenland. • Antarctica is only the 5th largest continent, not ginormous.
Mollweide Projection • Karl Mollweide invented in 1805 but didn’t become popular as a projection until 1857, more than 30 years after he died. • Distorts: Distance, shape, and direction • Maintains: Area • Strengths: • You can accurately compare landmasses (hey, Greenland is only about the size of Mexico!) • Weaknesses: • Where Mercator distorts size like crazy, Mollweide distorts shape, smushing towards the poles Missed Picture Day And Re-Take Day
Lambert Conic Projection • First created by J.H. Lambert in 1772 by Swiss mathematician, physicist, philosopher, and astronomer, became popular during WWI. • Distorts: Everything farther away from the line where the “cone” touches the globe. • Maintains: Everything close to the line where the “cone” meets the “globe.” • Strengths: • One of the projections most commonly used by pilots to plot courses • Great for intermediate scale maps -shows mid-latitude areas like the United States and Canada with very little distortion • Weaknesses: • Poor choice for world maps – way too much distortion farther out! Missed Picture Day And Re-Take Day
Believe it or not, I was quite popular with the ladies. I got invited to all the cool parties so I could explain my projection! Robinson Projection • Created by Arthur H. Robinson in 1961, used by National Geographic from 1988 to 1998. • Distorts: Everything! (but only a little) • Maintains: Nothing! (It’s a compromise) • Strengths: • Still distorted at poles, but as you move towards the equator, it quickly becomes much less distorted. • And who really cares about the poles anyway? (REALLY, not too many people do) • As a compromise it does everything pretty well, but nothing great. • Weaknesses: • As a compromise it does everything pretty well, but nothing superb. • The WinkelTripel projection is overall better (at least according to National Geographic.) Not us! Missed Picture Day And Re-Take Day
Gall-Peters Projection • New method of making 2D map of 3D world invented by James Gall (an astronomer who used it to map the stars) in 1855. • Arno Peters invents it again in 1967! (Most likely, he knew nothing about the Gall projection because he was not a cartographer, but a film-maker.) • Peters became interested in mapmaking to create a map that showed that the developing world (poorer countries around the equator) aren’t less important that the rich ones (generally in the north, stretched out by Mercator maps). • He campaigned against what he called “cartographic imperialism.” • Distorts: Shape, Distance • Maintains: Area, Direction • Strengths: • Supporters claim Gall-Peters is not racist (implying that Mercator maps are) and shows the world the way it should be! • Weaknesses: • Mercator maps had been largely discarded by geographers by the time Peters came around. • It has similar problems to Mercator, only exchanging shape for area. • There’s also the whole thing with him “inventing” something that had already been invented. Missed Picture Day And Re-Take Day
WinkelTripel Projection • Oswald Winkel was a man with a mission – make a map that minimized distortion! By golly, he did! His tripel projection from 1921 (triple in German, his third projection) is currently used by the National Geographic Society for world maps. • Distorts: Everything (but minimizes distortion of area, direction, and distance) • Maintains: Nothing (but area, direction, and distance are pretty close.) • Strengths: It’s good at everything, but perfect at nothing. • Weaknesses: It’s good at everything, but perfect at nothing. This is NOT Oswald Winkel, who apparently was camera shy. This is Oswald Von Wolkensteinwho popped up on the search results and just seemed really interesting. Missed Picture Day And Re-Take Day
Interrupted GoodeHomolosine Projection • John Paul Goode created the his interrupted projection in 1908. • Distorts: Most obviously, the surface of the Earth is not divided into chunks, also distance, direction, shape • Maintains: Area • Strengths: • Very useful in human geography because of lack of concern about the ocean. • Thematic maps about language, population, or government • Or it can be great for ocean geography too! • Weaknesses: • The “orange peel” problem is obvious – the map is not continuous. Missed Picture Day And Re-Take Day