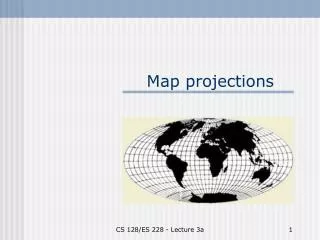
Map Projections
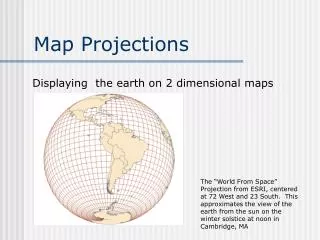
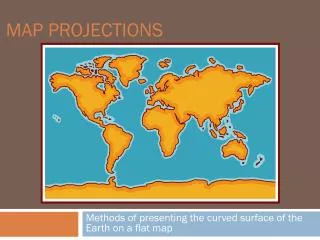
This article explores the intricacies of map projections, the tools geographers use to represent the Earth's surface. While globes offer an accurate depiction of the planet, flattening them into maps inevitably distorts distance, size, shape, and direction. We delve into various projection types, including cylindrical, conical, and azimuthal, and their respective advantages and drawbacks. Learn how these projections help navigate our world and why understanding their limitations is crucial for accurate geographical comprehension.

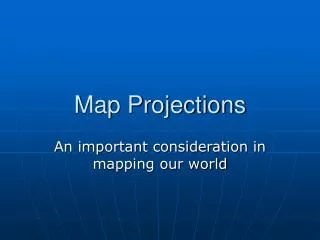
Map Projections
E N D
Presentation Transcript
Tools of Geography • The most useful tool for looking at where things are in the WORLD is a globe • It is an accurate, miniature of the actual earth • It shows correct distance, size (area), shape, and direction
From Globe to Map • Every flat map misrepresents the globe in one way or another—NO EXCEPTIONS! • This is because the globe is a three dimensional object and maps are two dimensional • EVERY MAP IS DISTORTED!!! • Imagine peeling off an orange peel in once big piece. When you put it back together without the orange inside, it still forms a sphere. If you try to make it into a flat surface, the pieces tear apart.
Global Gores • One way to try to overcome the problem of turning a globe into a flat mapis global gores • The globe is cut into sections to make the map • However, the sections are still somewhat distorted • Also, it is not very usefulto read a map with gapsin the middle of places
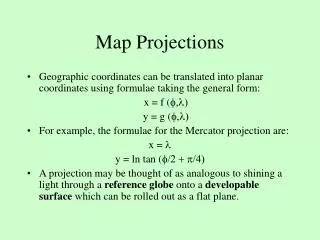
So, how do they make maps? • Through projections!!! • Instead of “cutting up the globe,” they “project” it ontopaper. • Imagine a light bulb inside ofthe globe that casts shadows of land formations onto a piece of paper. • If we trace the shadows, wehave a map
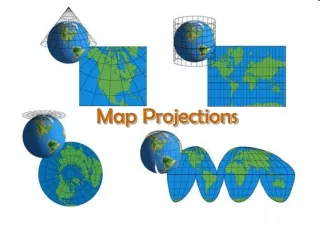
Why are there different map projections? • Depending on WHERE and HOW they hold the paper, we get different types of maps. • Most common are cylindrical, conical, and azimuthal (planar) projections
Map Distortions • Unfortunately, all maps are DISTORTED • All maps have at least one distortion • Four things get distorted on maps • Some maps will distort some things and not others • DISTANCE: How far apart things are • SIZE (AREA): How big a place is • SHAPE: What the form of a place looks like • DIRECTION: Where places are in relation to each other; In other words, which direction should you REALLY go if you want to get somewhere?
Distance Distortion Unequal Equal Mercator
Size (Area) Distortion Miller Cylindrical
Shape Distortion Gall Peters
Direction Distortion Inaccurate Accurate
Three Categories of Maps • Conformal: Show true SHAPES but distorted SIZES • Equal-Area: Show true SIZE but distorted SHAPES • Compromise: Show some SIZE distortion in order to portray shapes more accurately
Mercator Projection • Conformal Map • Used for navigation of ships • Good: True direction shown at any two points on a straight line • Bad: Size distortion at higher latitudes
Robinson Projection • Compromise Map • Uses: Educational materials • Good: Reasonable overall picture of the world • Bad: Distortion in polar areas
Azimuthal Projection • Compromise • Uses: Pilots use it to find the Great Circle Route (see next slide) • Good: Shows accurate direction • Bad: Distance and size distorted
Great Circle Route • A great circle path is the shortest path on the surface of a sphere between two points on that sphere • http://www.gcmap.com/ • It is shorter to take a circle route and fly with the curve of the earth, than to take a straight line The great circle as plotted with 5° of longitude between the waypoints is 4627 M The composite route as plotted with 3° of longitude between waypoints is 4669 M. The rhumb line is 4843 M.