Download
1 / 36
360 likes | 459 Views
This comprehensive report by Mary Burnett NRM Region explores key stressors impacting estuaries, such as habitat disturbance and litter, offering a stressor-based approach to evaluation. It presents a framework for assessing estuary health, including indicators, scores, and risk analysis, to aid in decision-making and management actions. The report highlights the benefits of the framework, such as cost-effectiveness, early response to management actions, and improved reporting capabilities. With monitoring data from multiple sites, including condition, pressure, and vulnerability indicators, the report aims to enhance estuary monitoring efforts and promote collaborative data sharing among agencies, local authorities, and communities for improved estuary management. Contact David Scheltinga at EPA for more information.

E N D
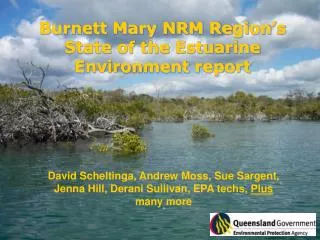
Burnett Mary NRM Region’s State of the Estuarine Environment report David Scheltinga, Andrew Moss, Sue Sargent, Jenna Hill, Derani Sullivan, EPA techs, Plus many more
Stressor based approach Stressors: Aquatic sediments Bacteria/pathogens Biota removal/disturbance Freshwater flow regime Habitat removal/disturbance Hydrodynamics Litter Nutrients Organic matter Pest (plant, animal) species pH Toxicants What are key stressors impacting on estuaries?
Steve Posselt Pests
Human activity Direct pressure Pressure mediating factors – e.g. Farm BMP, zero till, trash blanketing % ground cover Sediment load Phys-chem state Biological impact Estuary’s ‘intrinsic’ mediating factors – e.g. its length and tidal range Turbidity % cover seagrass Framework logic – Cause and Effect e.g. Stressor ‘sediments’
Vulnerability score Pressure indicator score X Overall estuary risk score Overall estuary health score Comparison against thresholds Stressor Risk score Stressor 1 Condition score Score adjusted Stressor 2 Condition score Stressor ranking Condition indicator 1 score Condition indicator 2 score Comparison against thresholds Score boost Indicator weighting Raw data Raw data Comparison against thresholds Assessment and Scoring
Benefits of the framework • Numerous benefits for decision support • Allows the identification of the key pressures in the area • which can help identify what the key condition indicators to monitor are (i.e. only monitor relevant indicators) • which can then be the targets of management actions • Allows justification for why and where did management work
Benefits of the framework • Is relatively cheap and easy to perform ‘risk’ analysis • Pressure indicators will respond to management action much earlier than condition indicators • Identify the causes and effects, making it easier to identify appropriate management actions • Can be used for various reporting needs • Report on dependability and confidence
9 new estuaries monitored by BMRG 10 additional sites monitored by EPA and funded by BMRG Sites
What is being monitored • 37 condition, 51 pressure and 7 vulnerability indicators • Started April 2007 • Currently have information on about 75% • Finish May 2008 and report soon after
pest species in adjoining areas stormwater
commercial and recreational fisher usage port/harbour/marina and boating activity
Photo NRW Unsealed road density
Google Earth Riparian vegetation Tidal barrage; estuary loss Photo SEQ Catchments impoundment density
Clear runoff Turbid runoff Photo NRW
Experiment at Mt Mort near Ipswich Results from a 54mm storm Matching stocking rates to pasture availability is the key to effective management in grazing lands Finlayson and Silburn, 1996
mangrove extent Google Earth seagrass extent, % cover and % epiphytic growth saltmarsh extent
bacteria counts toxicants in sediments toxicants in water
chlorophyll-a and nutrients pH, DO, turbidity
Presence of litter Accumulation rate of litter
Neuse River, USA - http://switchstudio.com/waterkeeper/issues/Spring%2007/neuse.html mass mortality events red-spot disease Photo QASSIT, NRW
Example – vulnerability • natural water clarity • flushing rate • presence of conservation areas • tidal range • resuspension rate
Mary River Kauri Creek
Summary • A way forward is being developed (slowly) for integrating agency, local authority and community monitoring data • Advantages to all parties by working cooperatively – sharing resources, knowledge, methods, QA, etc. • Both able to make good use of the data (provided that the quality is good) • to compare with guidelines • data used to establish a baseline for estuaries • QA important if data is to be of real use – the direct involvement of the EPA helps to ensure this • Get outcomes that are useful to all (improved health) • Provided that all parties do their bit properly and comprehensively
Contact David Scheltinga EPA david.scheltinga@epa.qld.gov.au (07) 3896 9242