Download
1 / 18
180 likes | 292 Views
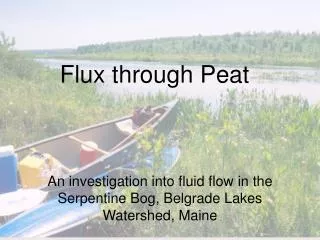
This study investigates fluid flow in Serpentine Bog, a critical component of the Belgrade Lakes Watershed in Maine. By applying Darcy’s Law and utilizing various hydrological models, we analyze hydraulic head, discharge rates, and groundwater movement within the bog's complex geology. The research aims to test hypotheses regarding groundwater flow and predict system responses under changing conditions. Data collected include hydraulic gradients, weather impacts, and results from slug tests, offering insights into the interplay between surface water and groundwater in wetland ecosystems.

E N D
Flux through Peat An investigation into fluid flow in the Serpentine Bog, Belgrade Lakes Watershed, Maine
BelgradeLakes • A – Maine • B – Belgrade Lakes Watershed • C – Surficial Geology • D – Bedrock Geology
Site Description Serpentine Bog Corridor
Darcy’s Law Discharge (Q) Cross-sectional area (A) Hydraulic gradient (dh/dl) Constant (K)
Hydraulic HeadandWeather Data Northern Transect Southern Transect Serpentine Datalogger Weather
Slug Tests Northern Transect Southern Transect Serpentine Datalogger
Numerical Modeling Why? (1) Test hypotheses about groundwater flow through a system (2) Predict how the system would respond to different conditions How? (1) Finite Difference Grid (2) Properties and Boundaries (3) Calibration (4) Additional Models Column Row Layer
Hydraulic Properties Cross Section Slug Tests Layer 1 Row 17
Base Model Results Groundwater Map (Layer 1) Velocity Map (Layer 1) Surface Water Head = 9.71 m Recharge = 1347 mm/year Velocity Map (Row 3)
Runs 1 & 2 Surface Water Head = 9.71 m Recharge = -86 mm/year Surface Water Head = 9.71 m Recharge = 2353 mm/year Groundwater Map Layer 1 Velocity Row 3 Velocity
Runs 3 & 4 Surface Water Head = 10.02 m Recharge = 1347 mm/year Surface Water Head = 9.58 m Recharge = 1347 mm/year Groundwater Map Layer 1 Velocity Row 3 Velocity
Conclusions • Geometry • K = 3.49*10-6 cm/s to ~2.36*10-4 cm/s • General ideas on fluid flux • Effect of water table and precipitation on system • Temporal changes > spatial changes • How much faith should be placed in any numerical model?
Acknowledgements • Dr. Jennifer Shosa • Dr. Bruce Rueger, Dr. Robert Gastaldo and Alice Ridky • Dr. Whitney King • Katie Curtis and Dan Pace • Jerry and Betsy Tipper • East Pond Association • ACS-PRF Grant # 40810-GB8