Download
1 / 52
540 likes | 876 Views
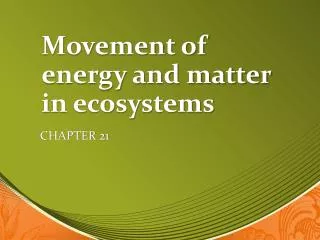
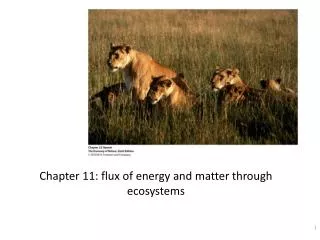
Chapter 11: flux of energy and matter through ecosystems. “Like all biological entities, ecological communities require matter for their construction and energy for their activities.

E N D
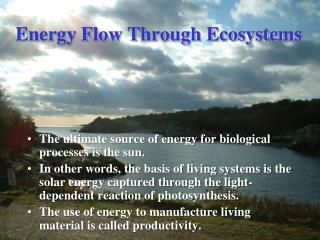
“Like all biological entities, ecological communities require matter for their construction and energy for their activities. We need to understand the routes for which matter and energy enter and leave ecosystems, how they are transformed into plant biomass, and how this fuels the rest of the community – bacteria and fungi, herbivores, detritivores and their consumers.”
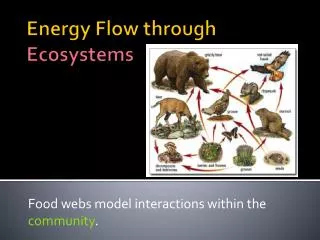
Background: Organizing Concepts • In 1920s, English ecologist Charles Elton and others promoted a revolutionary concept: • organisms living in the same place not only have similar tolerances of physical factors, but • feeding relationships link these organisms into a single functional entity • This system of feeding relationships is called a food web.
The Ecosystem Concept • The English ecologist A.G. Tansley took Elton’s ideas one step further: • in 1935 Tansley coined the term ecosystem, the fundamental unit of ecological organization • the ecosystem concept: “the biological and physical parts of nature together, unified by the dependence of animals and plants on their physical surroundings and by their contributions to maintaining the conditions and composition of the physical world.” -R.E. Ricklefs
Some key terms • Standing crop • Bodies of the living organisms within a unit area • Biomass • Mass of organisms per unit area of ground (or water); usually expressed in units of energy or dry organic matter • Primary productivity • Rate at which biomass is produced per unit area by plants • Gross primary productivity • Total fixation of energy by photosynthesis • Net primary productivity = GPP - Respiration • Secondary productivity • Rate of production of biomass by heterotrophs
More key terms • Live consumer system • Proportion of primary production consumed by herbivores – who are then consumed by carnivores • Decomposer system • Fraction of NPP not eaten by herbivores reaches decomposer system • Two groups responsible for decomposition of detritus • Bacteria and fungi: decomposers • Animals that consume dead matter: detritivores
Geographic patterns in PP Productivity of forests, grasslands, crops and lakes follows a latitudinal pattern
What limits PP? • Terrestrial communities: • Solar radiation, carbon dioxide, water and soil nutrients: resources required for PP • Temperature, a condition, strong influence • IF other resources were in abundant supply, radiation would be used more efficiently [eg: conifer communities only uses between 1 to 3 % of available radiation] • Rainfall strongly correlated with productivity • Of the minerals, the one with strongest influence on community productivity: fixed nitrogen [not atmospheric N] • May be limited by a succession of factors
What limits PP in aquatic environment? • Availability of nutrients (nitrate and phosphate) • Intensity of solar radiation that penetrates water column
Relationship between PP and SP • Positive relationship • Secondary productivity by zooplankton, eat phytoplankton cells, positively related to phytoplankton productivity • Productivity of heterotrophic bacteria – also +ive with phyotplankton • Caterpillars abundance linked to primary productivity (which is linked to annual rainfall) • Seed-eating finch – raises more broods In wet years (increased plant production)
Where does the energy go? • In aquatic and terrestrial communities: SP is 1/10 of PP (1) not all of plant biomass is consumed alive by herbivores (2) not all plant biomass eaten by herbivores is assimilated and available for incorporation into consumer biomass. [what happens to the rest?] (3) not all energy assimilated is converted to biomass [what happens to the rest?]
Alfred J. Lotka, the Thermodynamic Concept, and Lindeman’s concept • Alfred J. Lotka introduced the concept of the ecosystem as an energy-transforming machine: • described by a set of equations representing exchanges of matter and energy among components, and • obeying thermodynamic principles that govern all energy transformations • In 1942, Raymond Lindeman brought Lotka’s ideas of the ecosystem as an energy-transforming machine to the attention of ecologists. He incorporated: • Lotka’s thermodynamic concepts • Elton’s concept of the food web as expression of the ecosystem’s structure • Tansley’s concept of the ecosystem as the fundamental unit in ecology
Thermodynamics and Ecology • 1st law of thermodynamics - Energy can be neither created nor destroyed. It can only change forms. • 2nd law of thermodynamics - spontaneous natural processes increase entropy overall • the total biomass ALWAYS decreases with increasing trophic levels, as energy is constantly being lost to the atmosphere • So?
Lindeman’s Foundations of Ecosystem Ecology • The ecosystem is the fundamental unit of ecology. • Within the ecosystem, energy passes through many steps or links in a food chain. • Each link in the food chain is a trophic level (or feeding level). • Inefficiencies in energy transformation lead to a pyramid of energy in the ecosystem.
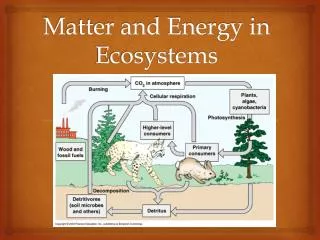
Odum’s Energy Flux Model • Eugene P. Odum popularized ecology to a generation of ecologists. • Odum further developed the emerging framework of ecosystem ecology: • he recognized the utility of energy and masses of elements as common “currencies” in comparative analysis of ecosystem structure and function • Odum extended his models to incorporate nutrient cycling. • Fluxes of energy and materials are closely linked in ecosystem function. However, they are fundamentally different: • energy enters ecosystems as light and is degraded into heat • nutrients cycle indefinitely, converted from inorganic to organic forms and back again • Studies of nutrient cycling provide an index to fluxes of energy.
Simple Ecosystem Model energy input from sun PHOTOAUTOTROPHS (plants, other producers) nutrient cycling HETEROTROPHS (consumers, decomposers) energy output (mainly heat)
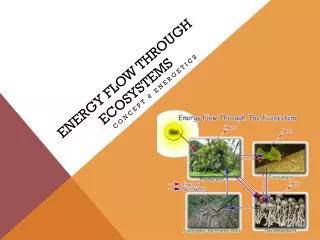
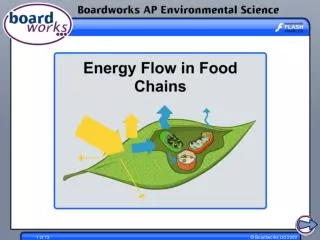
Models of ecological energy flow A food chain A single trophic level
Only 5% to 20% of energy passes between trophic levels. • Energy reaching each trophic level depends on: • net primary production (base of food chain) • efficiencies of transfers between trophic levels - More on this later - • Plant use between 15% and 70% of light energy assimilated for maintenance – thus that portion is unavailable to consumers • Herbivores and carnivores expend more energy on maintenance than do plants: production of each trophic level is only 5% to 20% that of the level below it.
Ocean food pyramid – roughly 2500 lbs/1136 kg of phytoplankton to support 0.5lb/0.23 kg of tuna
Only 5% to 20% of energy passes between trophic levels. • Energy reaching each trophic level depends on: • net primary production (base of food chain) • efficiencies of transfers between trophic levels • Plant use between 15% and 70% of light energy assimilated for maintenance – thus that portion is unavailable to consumers • Herbivores and carnivores expend more energy on maintenance than do plants: production of each trophic level is only 5% to 20% that of the level below it.
Ecological Efficiency • Ecological efficiency (food chain efficiency) is the percentage of energy transferred from one trophic level to the next: • range of 5% to 20% is typical, as we’ve seen • to understand this more fully, we must study the use of energy within a trophic level • el Undigested plant fibers in elephant dung
Intratrophic Energy Transfers • Intratrophic transfers involve several components: • ingestion (energy content of food ingested) • egestion (energy content of indigestible materials regurgitated or defecated) (the elephant dung) • assimilation (energy content of food digested and absorbed) • excretion (energy content of organic wastes) • respiration (energy consumed for maintenance) • production (residual energy content for growth and reproduction)
Fundamental Energy Relationships • Components of an animal’s energy budget are related by: • ingested energy - egested energy = assimilated energy • assimilated energy - respiration - excretion = production
Assimilation Efficiency • Assimilation efficiency = assimilation/ingestion • primarily a function of food quality: • seeds: 80% • young vegetation: 60-70% • plant foods of grazers, browsers: 30-40% • decaying wood: 15% • animal foods: 60-90%
Net Production Efficiency • Net production efficiency = production/assimilation • depends largely on metabolic activity: • birds: <1% • small mammals: <6% • sedentary, cold-blooded animals: as much as 75% • Gross production efficiency = assimilation efficiency x net production efficiency = production/ingestion, ranges from below 1% (birds and mammals) to >30% (aquatic animals).
Active, warm-blooded animals – low net production efficiencies; hummingbird: <1%
Production Efficiency in Plants • The concept of production efficiency is somewhat different for plants because plants do not digest and assimilate food: • net production efficiency = net production/gross production; varies between 30% and 85% • rapidly growing plants in temperate zone have net production efficiencies of 75-85%; their counterparts in the tropics are 40-60% efficient
Detritus Food Chains • Ecosystems support two parallel food chains: • herbivore-based (relatively large animals feed on leaves, fruits, seeds) • detritus-based (microorganisms and small animals consume dead remains of plants and indigestible excreta of herbivores) • herbivores consume: • 1.5-2.5% of net primary production in temperate forests • 12% in old-field habitats • 60-99% in plankton communities
Exploitation Efficiency • When production and consumption are not balanced, energy may accumulate in the ecosystem (as organic sediments). • Exploitation efficiency / trophic transfer efficiency = ingestion by one trophic level/production of the trophic level below it. • To the extent that exploitation efficiency is <100%, ecological efficiency = exploitation efficiency x gross production efficiency.
Reminder of key terms • Consumption efficiency (CE) • Assimilation efficiency (AE) • Production efficiency (PE)
Some General Rules • Assimilation efficiency increases at higher trophic levels. • Net and gross production efficiencies decrease at higher trophic levels. • Ecological efficiency averages about 10%. • About 1% of net production of plants ends up as production on the third trophic level: the pyramid of energy narrows quickly. • To increase human food supplies means eating lower on food chain! • [virtual water]
Virtual waterhttp://environment.nationalgeographic.com/environment/freshwater/embedded-water/
Virtual waterhttp://environment.nationalgeographic.com/environment/freshwater/embedded-water/
Virtual waterhttp://environment.nationalgeographic.com/environment/freshwater/embedded-water/
Virtual waterhttp://environment.nationalgeographic.com/environment/freshwater/embedded-water/
Virtual waterhttp://environment.nationalgeographic.com/environment/freshwater/embedded-water/
Live consumer and decomposer systems: general patterns of energy flow
Live consumer and decomposer systems: general patterns of energy flow DOM: dead organic matter LCS: live consumer system Relative sizes of boxes and arrows are proportional to the relative magnitude of compartments and flows
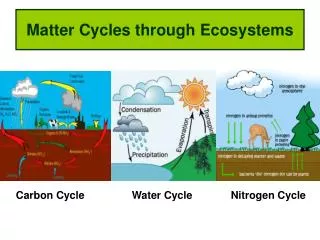
Process of decomposition • Immobilization – when an inorganic nutrient element is incorporated into organic form, primarily during the growth of green plants [carbon dioxide becoming carbohydrates, eg] • Mineralization – conversion of elements from organic back to an inorganic form • Decomposition – the gradual disintegration of dead organic matter by both physical and biological agents
Who decomposes? • Bacteria and fungi: begin the process of decomposition. Use soluble materials (amino acids and sugars) • Microbial specialists: break down residual resources (structural carbohydrates and complex proteins) • Some specialist microbivores feed on bacteria and fungi • Microbivores: group of animals that operate alongside the detritivores; minute animals that specialize at feeding on bacteria or fungi but are able to exclude detritus from their guts
What do they eat? • Plant detritus • Two of the major components of dead leaves and wood: cellulose and lignin • Lacking cellulase enzymes, majority of detritivores depend on production of cellulases by associated bacteria or fungi or protozoa
What do they eat? Feces and carrion [decaying flesh of dead animals] • Carnivorous vertebrates: poor quality dung [feces, manure]. Why? • Elephant dung within minutes eaten by adult dung beetles feed on the the dung, bury large quantities along with their eggs to provide food for their larvae • Without those beetles, though… • Cattle dung. Cow pop increased from 7 in 1788 to 30 million in 1988 – producing 300 million cowpats/day – in Australia • Lack of native dung beetles loss of 2.5 million ha/year/ under dung. So introduced 20 species of beetles
Energy moves through ecosystems at different rates. • Other indices address how rapidly energy cycles through an ecosystem: • residence time measures the average time a packet of energy resides in storage: • residence time (yr) = energy stored in biomass/net productivity • biomass accumulation ratio is a similar index based on biomass rather than energy: • biomass accumulation ratio (yr) = biomass/rate of biomass production