Download

1 / 44
440 likes | 458 Views
Learn about capacity planning for products and services, key decisions, strategic formulation, forecasting, and cost-volume relationships to enhance competitiveness. Understand calculating processing requirements, in-house versus outsourcing, and developing capacity alternatives.

E N D
5 Capacity Planning For Products and Services
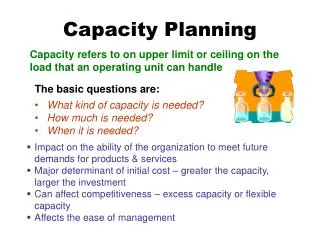
Capacity Planning • Capacity is the upper limit or ceiling on the load that an operating unit can handle. • Capacity also includes • Equipment • Space • Employee skills • The basic questions in capacity handling are: What kind of capacity is needed? How much is needed? When is it needed?
Importance of Capacity Decisions • Impacts ability to meet future demands • Affects operating costs • Major determinant of initial costs • Involves long-term commitment • Affects competitiveness • Affects ease of management • Globalization adds complexity • Impacts long range planning
Capacity • Design capacity • maximum output rate or service capacity an operation, process, or facility is designed for • Effective capacity • Design capacity minus allowances such as personal time, maintenance, and scrap • Actual output • rate of output actually achieved--cannot exceed effective capacity.
Efficiency and Utilization Actual output Efficiency = Effective capacity Actual output Utilization = Design capacity Both measures expressed as percentages
Efficiency/Utilization Example Actual output = 36 units/day Efficiency = = 90% Effective capacity 40 units/ day Utilization = Actual output = 36 units/day = 72% Design capacity 50 units/day Design capacity = 50 trucks/day Effective capacity = 40 trucks/day Actual output = 36 units/day
Determinants of Effective Capacity • Facilities • Product and service factors • Process factors • Human factors • Policy factors • Operational factors • Supply chain factors • External factors
Strategy Formulation • Capacity strategy for long-term demand • Demand patterns • Growth rate and variability • Facilities • Cost of building and operating • Technological changes • Rate and direction of technology changes • Behavior of competitors • Availability of capital and other inputs
Key Decisions of Capacity Planning • Amount of capacity needed • Timing of changes • Need to maintain balance • Extent of flexibility of facilities
Steps for Capacity Planning • Estimate future capacity requirements • Evaluate existing capacity • Identify alternatives • Conduct financial analysis • Assess key qualitative issues • Select one alternative • Implement alternative chosen • Monitor results
Forecasting Capacity Requirements • Long-term vs. short-term capacity needs • Long-term relates to overall level of capacity such as facility size, trends, and cycles • Short-term relates to variations from seasonal, random, and irregular fluctuations in demand
Calculating Processing Requirements If annual capacity is 2000 hours, then we need three machines to handle the required volume: 5,800 hours/2,000 hours = 2.90 machines
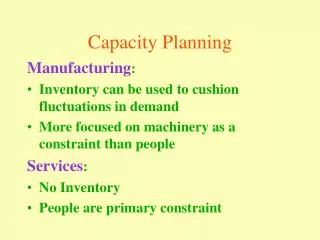
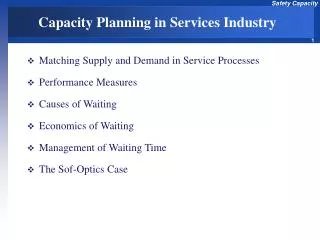
Planning Service Capacity • Need to be near customers • Capacity and location are closely tied • Inability to store services • Capacity must be matched with timing of demand • Degree of volatility of demand • Peak demand periods
In-House or Outsourcing Outsource: obtain a good or service from an external provider • Available capacity • Expertise • Quality considerations • Nature of demand • Cost • Risk
Developing Capacity Alternatives • Design flexibility into systems • Take stage of life cycle into account • Take a “big picture” approach to capacity changes • Prepare to deal with capacity “chunks” • Attempt to smooth out capacity requirements • Identify the optimal operating level
Bottleneck Operation 10/hr Machine #1 10/hr Bottleneck Operation 30/hr Machine #3 10/hr Machine #4 10/hr Figure 5.2 Bottleneck operation: An operationin a sequence of operations whosecapacity is lower than that of theother operations Machine #2
Bottleneck Operation Bottleneck Operation 120/hr. Operation 210/hr. Operation 315/hr. 10/hr. Maximum output ratelimited by bottleneck
Economies of Scale • Economies of scale • If the output rate is less than the optimal level, increasing output rate results in decreasing average unit costs • Diseconomies of scale • If the output rate is more than the optimal level, increasing the output rate results in increasing average unit costs
Optimal Rate of Output Average cost per unit Minimum cost 0 Rate of output Figure 5.4 Production units have an optimal rate of output for minimal cost. Minimum average cost per unit
Economies of Scale Figure 5.5 Minimum cost & optimal operating rate are functions of size of production unit. Small plant Average cost per unit Medium plant Large plant 0 Output rate
Evaluating Alternatives • Cost-volume analysis • Break-even point • Financial analysis • Cash flow • Present value • Decision theory • Waiting-line analysis
Cost-Volume Relationships Amount ($) Total cost = VC + FC Total variable cost (VC) Fixed cost (FC) 0 Q (volume in units) Figure 5.6a
Cost-Volume Relationships Total revenue Amount ($) 0 Q (volume in units) Figure 5.6b
Cost-Volume Relationships Profit Total revenue Amount ($) Total cost 0 BEP units Q (volume in units) Figure 5.6c
Break-Even Problem with Step Fixed Costs FC + VC = TC FC + VC = TC 3 machines FC + VC = TC 2 machines 1 machine Quantity Step fixed costs and variable costs. Figure 5.7a
Break-Even Problem with Step Fixed Costs $ BEP 3 TC BEP 2 TC 3 TC 2 TR 1 Quantity Multiple break-even points Figure 5.7b
Assumptions of Cost-Volume Analysis • One product is involved • Everything produced can be sold • Variable cost per unit is the same regardless of volume • Fixed costs do not change with volume • Revenue per unit constant with volume • Revenue per unit exceeds variable cost per unit
Financial Analysis • Cash Flow - the difference between cash received from sales and other sources, and cash outflow for labor, material, overhead, and taxes. • Present Value - the sum, in current value, of all future cash flows of an investment proposal.
5S Decision Theory
Learning Objectives • Describe the different environments under which operations decisions are made • Describe and use techniques that apply decision making theory under uncertainty • Describe and use the expected-value approach
Learning Objectives • Construct a decision tree and use it to analyze a problem • Compute the expected value of perfect information • Conduct sensitivity analysis on a simple decision problem
Location planning Capacity planning Equipment selection Decision Theory Decision Theoryrepresents a general approach to decision making which is suitable for a wide range of operations management decisions, including: Product andservice design
Decision Theory Elements • A set of possible future conditions exists that will have a bearing on the results of the decision • A list of alternatives for the manager to choose from • A known payoff for each alternative under each possible future condition
Decision Theory Process • Identify possible future conditions called states of nature • Develop a list of possible alternatives,one of which may be to do nothing • Determine the payoffassociated with each alternative for every future condition
Decision Theory Process (Cont’d) • If possible, determine the likelihood of each possible future condition • Evaluate alternatives according to some decision criterionand select the best alternative
Causes of Poor Decisions Bounded Rationality The limitations on decision making caused by costs, human abilities, time, technology, and availability of information
Causes of Poor Decisions (Cont’d) Suboptimization The result of different departments each attempting to reach a solution that is optimum for that department
Decision Process • Identify the problem • Specify objectives and criteria for a solution • Develop suitable alternatives • Analyze and compare alternatives • Select the best alternative • Implement the solution • Monitor to see that the desired result is achieved
Decision Environments • Certainty - Environment in which relevant parameters have known values • Risk - Environment in which certain future events have probable outcomes • Uncertainty - Environment in which it is impossible to assess the likelihood of various future events
Decision Making under Uncertainty Maximin - Choose the alternative with the best of the worst possible payoffs Maximax - Choose the alternative with the best possible payoff Laplace - Choose the alternative with the best average payoff of any of the alternatives Minimax Regret- Choose the alternative that has the least of the worst regrets
Decision Making Under Risk • Risk: The probability of occurrence for each state of nature is known • Risk lies between the extremes of uncertainty and certainty • Expected monetary value (EMV) criterion: • The best expected value among alternatives • Determine the expected payoff of each alternative, and choose the alternative with the best expected payoff
Decision Trees • Decision tree: a Schematic representation of the available alternatives and their possible consequences. • Useful for analyzing situations that involve sequential decisions • See Figure 5S.1
Format of a Decision Tree Payoff 1 State of nature 1 Payoff 2 Choose A’1 2 Choose A’ State of nature 2 Payoff 3 Choose A’2 B 1 Payoff 4 Choose A’3 State of nature 1 2 Choose A’2 Payoff 5 Choose A’4 Decision Point Payoff 6 State of nature 2 Chance Event Figure 5S.1
Expected Value of Perfect Information Expected value of perfect information:the difference between the expected payoff under certainty and the expected payoff under risk Expected value ofperfect information Expected payoffunder certainty Expected payoffunder risk - =