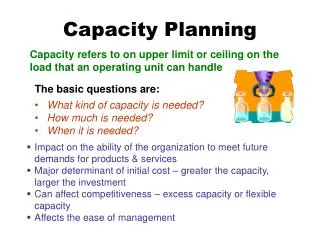
Capacity Planning
Capacity Planning. Chapter 14. Capacity Planning. Capacity planning decisions involve trade-offs between the cost of providing a service (i.e., increasing the number of servers) and the cost or inconvenience to the customer

Capacity Planning
E N D
Presentation Transcript
Capacity Planning Chapter 14
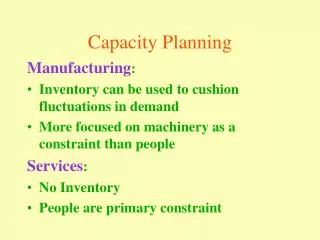
Capacity Planning • Capacity planning decisions involve trade-offs between the cost of providing a service (i.e., increasing the number of servers) and the cost or inconvenience to the customer • Involves determining the appropriate level of service capacity by specifying the proper mix of facilities, equipment, and labor required to meet anticipated demand
Single Server M/M/1 λ OOOO ■ λ = arrivals per time period O = customer ■ = server
M/M/1 Boat Launch Example If: λ = 6 boats arrive per hour μ = 10 boats launched per hour p = λ / μ Then: probability that the customer must wait is p = 6 / 10 = 0.6 or 60% probability that the customer does not have to wait is p0 = 1- 0.6 = 0.4 (40%)
M/M/1 Boat Launch Example Mean number of boats in the system: Ls = λ / (μ – λ) Ls = 6 / (10 – 6) = 6/4 = 1.5 boats Mean number of boats in the queue: Lq = (pλ) / ((μ – λ) Lq = (.6 x 6) / (10 – 6) = 3.6 / 4 = .9 boats
M/M/1 Boat Launch Example Mean time in the system: Ws = 1 / (μ – λ) = 1 / (10 – 6) = ¼ hour Mean time in queue: Wq = p / (μ – λ) = 0.6 / (10 – 6) = .15 hour
Multiple Servers M/M/c ■ λ OOOO ■ λ = arrivals per time period O = customer ■ = servers
M/M/4 Secretarial Pool Example If: λ = 9 requests per hour c = 4 servers p = λ / c (used to calculate the value of p0) Then: probability that a faculty member does not have to wait for secretarial work is P0 = 1 (9/4)0 + (9/4)1 + (9/4)2 + (9/4)3 + (9/4)4 0! 1! 2! 3! 4!(1-9/16) P0 = 0.098
M/M/4 Secretarial Pool Example Mean number of jobs in the system: p c+1 Ls = (P0 + p) (c-1)!(c-p)2 (9/4)5 Ls =(0.098) + 9/4 (4-1)!(4-9/4)2 Ls = 2.56
M/M/4 Secretarial Pool Example Mean time for each secretarial job in the system: Ls Ws = λ 2.56 Ws = = 0.28 or 17 minutes per job 9