Download
1 / 31
320 likes | 479 Views
Updating Soil Based Yield and Productivity Data in Ohio: Evaluation of CERES-Maize for Creating a Reliable and Transparent System for Updating Soil-Based Yield and Productivity Data at the Series Level. Jenette Goodman Dr. Brian Slater – Advisor The Ohio State University

E N D
Updating Soil Based Yield and Productivity Data in Ohio: Evaluation of CERES-Maize for Creating a Reliable and Transparent System for Updating Soil-Based Yield and Productivity Data at the Series Level Jenette Goodman Dr. Brian Slater – Advisor The Ohio State University School of Environment and Natural Resources
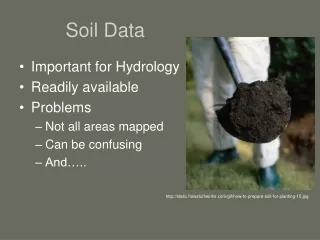
INTRODUCTION • Rational • In the state of Ohio, there is a need for reliable, accurate, and up to date soil yield and productivity data. • Yield/Productivity data is a tool used to aid in: • Land use and management decisions. • (agricultural vs. commercial /residential) • Cropping and fertilization strategies. • Assessment of a soil’s economic value. • Differential Tax Assessment Programs • All 50 states have some sort of tax relief. • Ohio: CAUV Program.
INTRODUCTION • the Current Agricultural Use Value Program • Agricultural land values in Ohio are assessed based on soil productivity and yield potential under the fairly controversial Current Agricultural Use Value (CAUV) program. • CAUV is a differential tax assessment program which allows farm land to be taxed according to agricultural and not full market value. • Rational behind CAUV assessment: • - Corrects an inherent “unfairness” in the real estate tax system, which places a large tax burden on farmland owners, who typically own large areas of land, yet use a small amount of community resources • - Preserves farmland by potentially helping offset increasing operating costs and such.
INTRODUCTION • CAUV Calculation • Farms Net Income • CAUV = __________________________ • Adjusted Capitalization Rate • Net Income = (projected gross income) - (projected production costs) • Projected gross income:computed starting with typical cropping patterns for the soil types found on a farm, applying the previous five year's statewide average yields per acre for each crop in the pattern, then multiplying these average yields by the previous five years' average price for each crop (Jeffers and Libby, 2008). CHANGES IN THESE YIELD NUMBERS HAVE SIGNIFICANT IMPACTS ON FARM OWNER AND COMMUNITIES ALIKE. FAMERS’ INCOMES AND COMMUITIES’ TAX REVINUES ARE DEPENDENT ON HOW THESE VALUES ARE DETERMINED. THEREFORE THE METHOD OF ASSESSMENT SHOULD TRANSPARENT, RELABLE, AND JUSTIFIABLE.
INTRODUCTION • Approaches to Yield Prediction • Empirical/regression based approach • Educated “estimations” based on expert soil and productivity knowledge • Reporting of yields (too little soil information) • Computer simulation of plant growth i.e. Models Our Method of Choice: Crop Growth Models
INTRODUCTION • Why Take a Computer Model Approach? • Issue to Consider: Not enough yield data associated with each specific soil series for a purely empirical approach. • Crop models are a well tested and generally accepted method for evaluating crop yield potential with limited data. • Many different crop growth models including : CERES, RZWQM • Models look mainly at carbon, nitrogen, water, and temperature dynamics at critical growth stages of plants • For this study, the CERES-Maize model (within the DSSAT cropping modeling software package) was selected to predict maize yield values for a number of soil series in Ohio .
INTRODUCTION • Overview of DSSAT • A Decision Support System for • Agrotechnology Transfer (DSSAT) • is a software package • containing various crop growth • models for a variety of crops • DSSAT is a software product that combines crop, soil and weather data bases into standard formats for access by crop models and applications (an integrated system which assists in generating appropriately formatted data for input into models) . • The user can simulate multi-year outcomes of crop management strategies for different crops at any location in the world. • It has been in use for more than 15 years by researchers in over 100 countries.
INTRODUCTION The Goal The object of this research project is to: 1.) Use existing soil, climate, and yield data to create a transparent and reliable system for generating yield and productivity data for Ohio soils at the soil series level; 2.) Evaluate the feasibility of using existing Ohio soil and maize yield data in combination with A Decision Support System for Agrotechnology Transfer (DSSAT) to generate accurate and reliable maize yields at the soil series level; 3.) To develop a method for generating soil profile input data representative of a typical series profile.
Overview of DSSAT (Jones, et al., 2003)
Overview of DSSAT (Jones, et al., 2003)
INTRODUCTION • The CERES – Maize Model • A process-level, comprehensive model that uses a daily time-step simulation to calculate and integrate growth and rates of change within the soil-plant-atmosphere system (Quiring and Legates, 2008). • Soil temperature is used to modify plant processes (emergence) and SOM decomposition. • - Highly dependent on soil / water relation and availability. • Predicts plant biomass and final grain yield
INTRODUCTION Generalized Modeling Process 1. Acquisition of minimum datasets -For DSSAT models this includes soil, weather, and management factor associated with specific yield data. 2. Generation of Appropriately formatted input files. -DSSAT provides software for this 3. Initial running of model 4. Model Calibration 5. Model Prediction and and Validation.
INTRODUCTION In a perfect world we would have test site for each soil series with a specific set of management practices. Data Requirements Soil – Profile analysis by horizon (texture, %OC, pH) Weather – Daily: max/min temp, precipitation Management – Row spacing, seeding rates, cultivars, etc. Yield – Yields for each soil series (calibration/validation)
INTRODUCTION • Generation of Weather Input Data • Required Minimum Weather Dataset • 1. latitude and longitude of the weather station • 2. daily values of incoming solar radiation (MJ/m²-day) • 3. maximum and minimum air temperature (ºC) • 4. rainfall (mm). • Source • Weather datasets are available from the National Oceanic and Atmospheric Administration (NOAA), National Climatic Data Center. This online resource, free to academic institutions, gives access to years of weather data from thousands of weather stations across the United States.
INTRODUCTION Defining Crop Management Inputs Required Minimum Management Dataset Management data: planting date, dates when soil conditions were measured prior to planting, planting density, row spacing, planting depth, crop variety, irrigation, and fertilizer practices. Sources Suggested management practices from the Ohio Agronomy Guide, 14th edition as well as agricultural practices commonly implemented in Ohio (Thomison et al., 2005). Actual, know management practices implemented at specific sites during specific growing seasons.
INTRODUCTION Generation of Soil Input Data Required Minimum Soil Dataset General: Surface slope, soil color, permeability, and drainage class. By Horizon: upper and lower horizon depths (cm) percentage sand, silt, and clay content 1/3 bar bulk density organic carbon pH in water aluminum saturation, and information on abundance of roots.. Sources: OSU Characterization Data, NRCS Official Descriptions
INTRODUCTION • Model Calibration • Ideally uses a combination of field experiments and computer simulations to most accurately represent the system being modeled. • Make necessary adjustments to model parameters as well as simulation results. • DSSAT does not offer any automated procedures for calibration. • Changes to parameters of the model in order to calibrate it for conditions specific to Ohio must be done manually, by making quantitative comparisons of model outputs to “fine tune” the model parameters. • Typically involves adjustment of cultivar parameters and soil profile data (water related) to minimize the RMSE between observed and simulated yields Model Validation Model validation involves taking the calibrated model and applying it to a new set of parameters. With DSSAT, calibration and validation dataset are usually associated with years of weather data. So one year(s) yield data will be used to calibrate the model, while another set of year(s) will be used for validation, with only the weather data and pest management for that year being changed (Thorp et al., 2008; Quiring and Legates, 2008).
INTRODUCTION Sources of Yield Data County Soil Surveys: Out of Date, described as map units, not individual soil series. CAUV: Computed using soil characteristics and production information contained in the 1989 Bulletin 685, entitled ‘Ohio Soils with Yield Data and Productivity Index’ Performance Trials: Actual, real yields, on known soils, with known management strategies.
METHODS • Overview • A Decision Support System for Agrotechnology Transfer (DSSAT) was used to predict maize yield for 30 soil series, implementing the CERES-MAIZE model. • Minimum datasets for soil, management, and weather data were aquired and input to DSSAT’s Sbuild, Xbuild, and Weatherman respectively to generate inputs for the CERES-Maize model. • The largest challenge of this study was to create a representative soil profile for input into CERES-maize model from existing soil profile data, without resampling.
METHODS • Soil Profile Selection / Generation • Reprehensive Soil Profile: Profiles chosen based on how well they appeared to represent the soil series within the range of values described in the official soil series descriptions. • Limitations: Number and kind of profiles and lab analysis is available. Risk of selection of non repetitive profile. • 2. Generic Profile Generation: The SSURGO database offers a range for physical and chemical properties of each soil series, along with a generic profile. • Limitations: Discrete definition of attributes from a range of values. To calibrate each profile for best prediction would require a very large effort.
METHODS • Modeling/Scenario Strategies • 1. Concept Validation: Use Ohio Soils with Yield Data and Productivity Index numbers for a number of “benchmark” soil series in Ohio. • 2. Soil Survey map unit yield estimates: Use most recent and reliable numbers from Wood, Hancock, and Allen County. • - Model each soil series, then construct yield estimates based on component proportion of map unit. • 3. Performance Trials
METHODS Scenario 1: Concept Validation • Weather • 30 years • NAEW Coshocton, Ohio. Soil: Representative profiles chosen from OSU Characterization Database. • Management • Suggested management practices of the Ohio Agronomy Guide, 14th edition (Thomison et al., 2005). Yield estimates published in 1989 Yield: Ohio Soils with Yield Data and Productivity Index’ .
METHODS Scenario 2: The 3 Counties • Weather: • 10 years • Wood, Hancock, and Allen County. Management: Ohio Agronomy Guide, 14th edition (Thomison et al., 2005). Soil: OSU Database Yield: Wood, Hancock, and Allen County Soil Survey (SSURGO)
METHODS Scenario 3: Performance Trials • Weather: • 1997 to 2009 • Performance trial location. Soil: Representative profiles chosen from OSU Characterization Database. • Management • Actual management information provided (fertilization, planting/harvesting, etc.) Use half the years for calibration and half for validation. Yield:Location average yield form 1997 to 2009
RESULTS/DISCUSSION Scenario 1: Concept Validation Yield Rankings
RESULTS/DISCUSSION Scenario 2: County Soil Survey Hancock County Estimate for Map Unit (BoA)= 9,541 Kg/ha
RESULTS/DISCUSSION Scenario 3: Performance Trials In Progress…
CONCLUSIONS • These preliminary results confirm that it may be possible to use the DSSAT CERES-maize model in conjunction with existing soil data to characterize maize yield and productivity of Ohio soils at the soil series level. • The model exhibited sensitivity to soil profile data input that the soil series level. • Model is only as accurate as the data to which it is calibrated. • More and better yield data is needed. • Definition of representative soil profile is essential and difficult. • Model exhibits sensitivity which may not be expressed in the generalized yield numbers provided by the CAUV and NRCS. • Lack sufficient data to reliably calibrate and validate for each soil series, but perhaps if the model is proven effective for a number of soil series, it may be acceptable to apply it to the remaining…. Is this not the point of modeling?
REFERENCES • Thomison, P., et al. OSU Extension Bulletin 472-05: Ohio Agronomy Guide . 14th ed. Vol. Chapter 4. The Ohio State University Extension, 2005. • Jones, J. W., Hoogenboom, G., Porter, C. H., Boote, K. J., Batchelor, W. D., Hunt, L. A., et al. (2003). The DSSAT cropping system model. European Journal of Agronomy, , 18(3-4) 235-265. • Brown, D. M. (1987). CERES-maize: A simulation model of maize growth and development: C.A. jones and J.R. kiniry (editors), texas A & M university press, college station, TX, 1986, 194 pp. + two diskettes. U.S. $33.50 (cloth). Agricultural and Forest Meteorology, 41(3-4), 339-339 • Jones, J. W., Hoogenboom, G., Porter, C. H., Boote, K. J., Batchelor, W. D., Hunt, L. A., et al. (2003). The DSSAT cropping system model. European Journal of Agronomy, , 18(3-4) 235-265. • Quiring, S. M., & Legates, D. R. (2008). Application of CERES-maize for within-season prediction of rainfed corn yields in delaware, USA. Agricultural & Forest Meteorology, 148(6), 964-975. • Thorp, K. R., DeJonge, K. C., Kaleita, A. L., Batchelor, W. D., & Paz, J. O. (2008). Methodology for the use of DSSAT models for precision agriculture decision support. Computers and Electronics in Agriculture, 64(2), 276-285.
ACKNOWLEGEMNTS Sincere thanks are offered to NRCS, Columbus for their financial support, Jeff Glanville from NRCS for his advice and assistance, Peter Thomison from OSU Extension for help with performance trial data. • …………